Availability Report
The availability report shows the average booking levels of segments of the network to identify under-booked and over-booked loop policies (see Loop Policies).
Note: Since preemptible campaigns are not guaranteed to play and apply no inventory pressure, they are not taken into account for the availability report.
To generate the availability report:
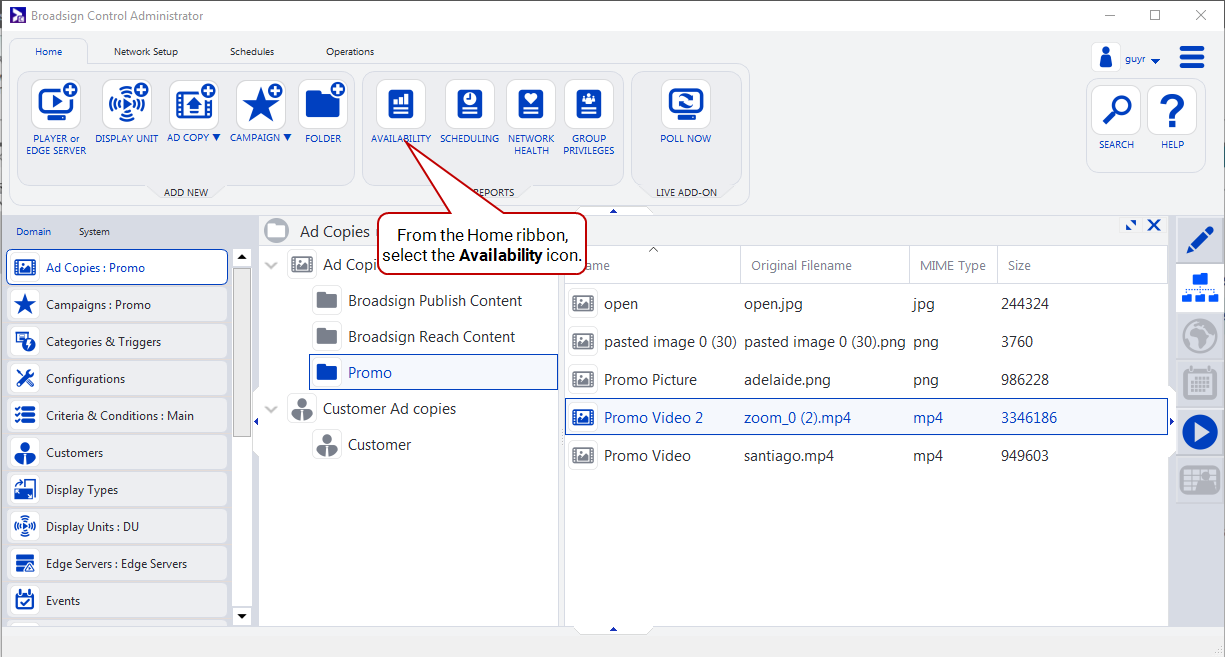
Use one of the following methods:
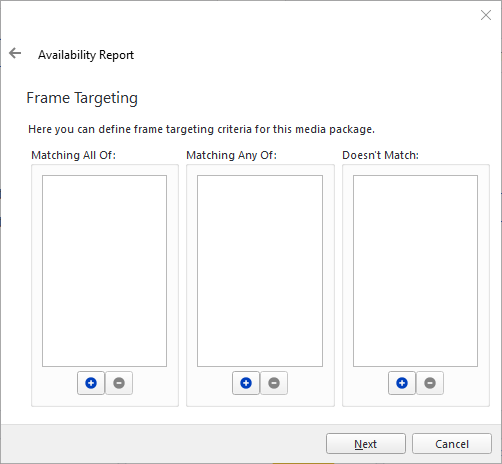
By default, the Availability Report wizard contains the following pages:
-
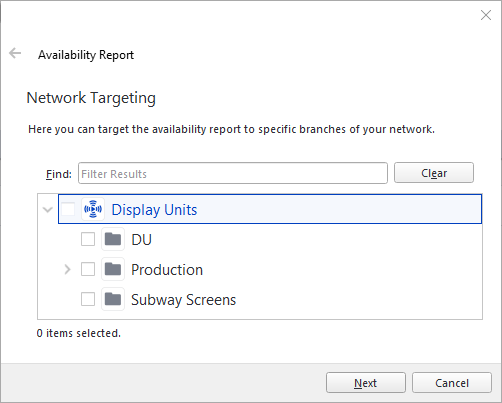
Network Targeting – Select the display units or display unit folders you want to target in your report.
-
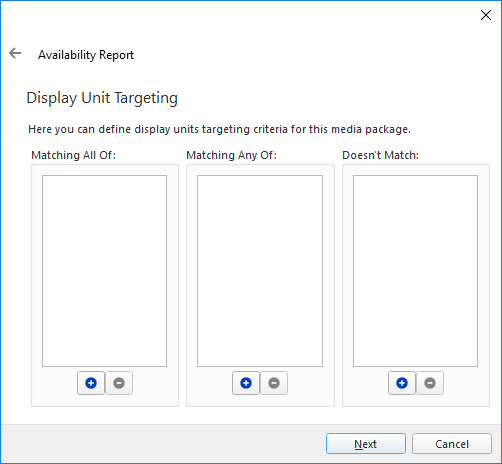
Display Unit Targeting – Target by display unit criteria, using Boolean operators (AND, OR or NOT). For more information, see Criteria and Conditions.
-
Frame Targeting – Target by frame criteria, using Boolean operators (AND, OR or NOT). For more information, see Frames and Criteria and Conditions.
-
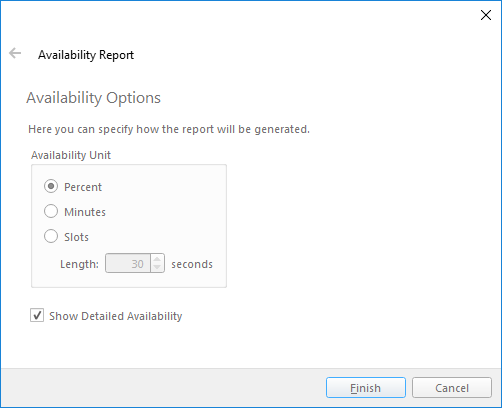
Availability Options – Specify how you would like the report results presented. You can choose which unit of availability you would like to see: percentages, number of minutes or number of slots of a certain length (measured in seconds).
Example: Consider two display units with 5-minute loops and 3 minutes of campaigns booked. Here are the results you would get for each availability unit type:
- Percent: 60% booked (180 seconds booked / 300 seconds available) * 100
- Minutes: 6 (3 minutes booked * 2 display units)
- Slots of 30 seconds: 6 (180 seconds booked / 30 second slot) * 2 display units
- Slots of 10 seconds: 36 (180 seconds booked / 10 second slot) * 2 display units
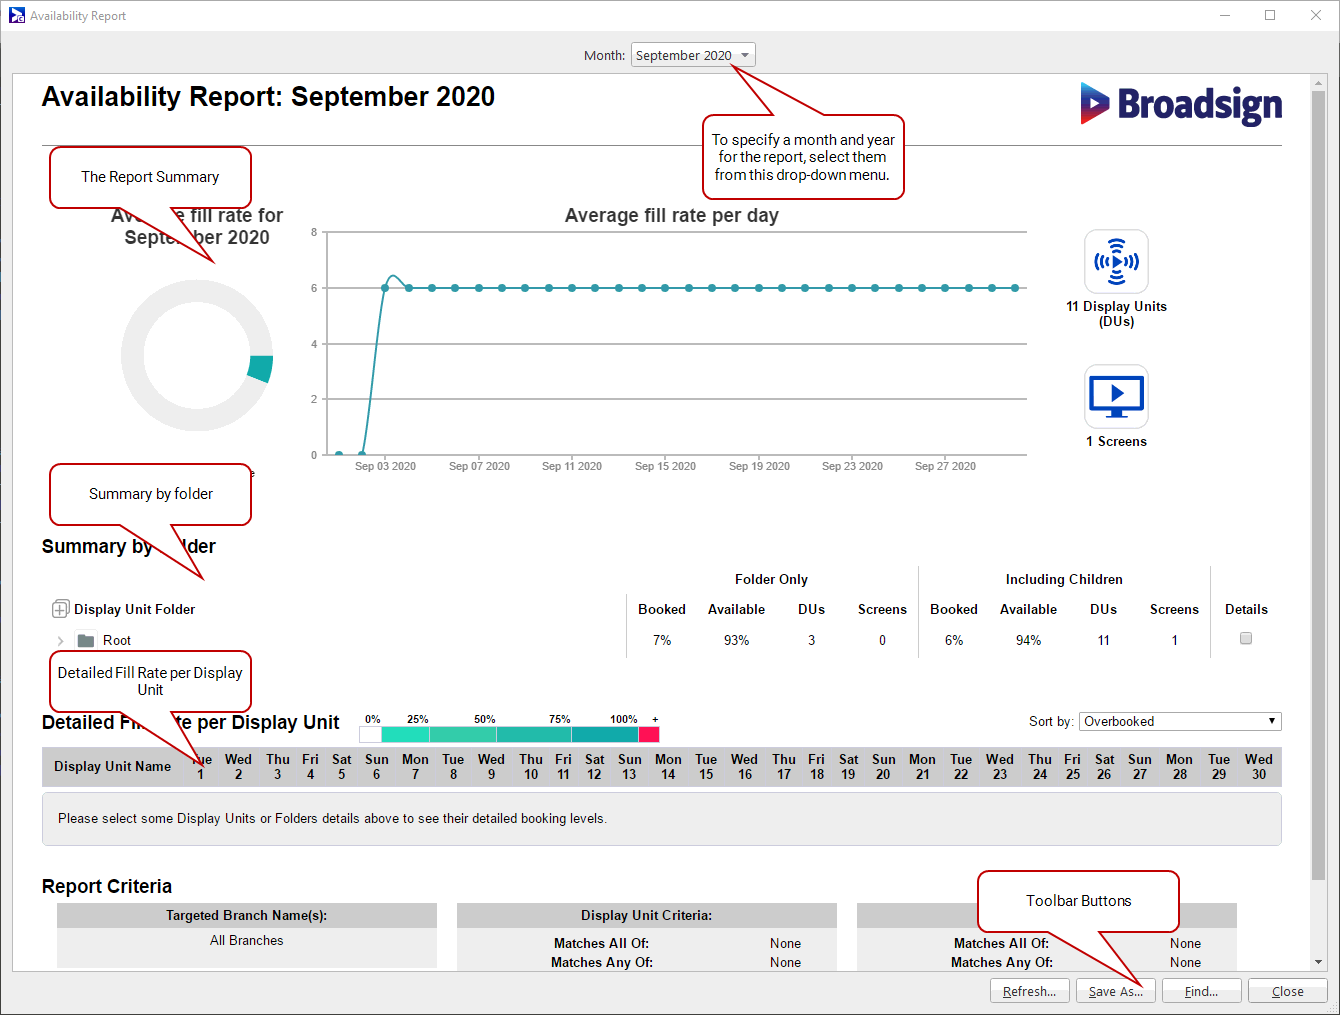
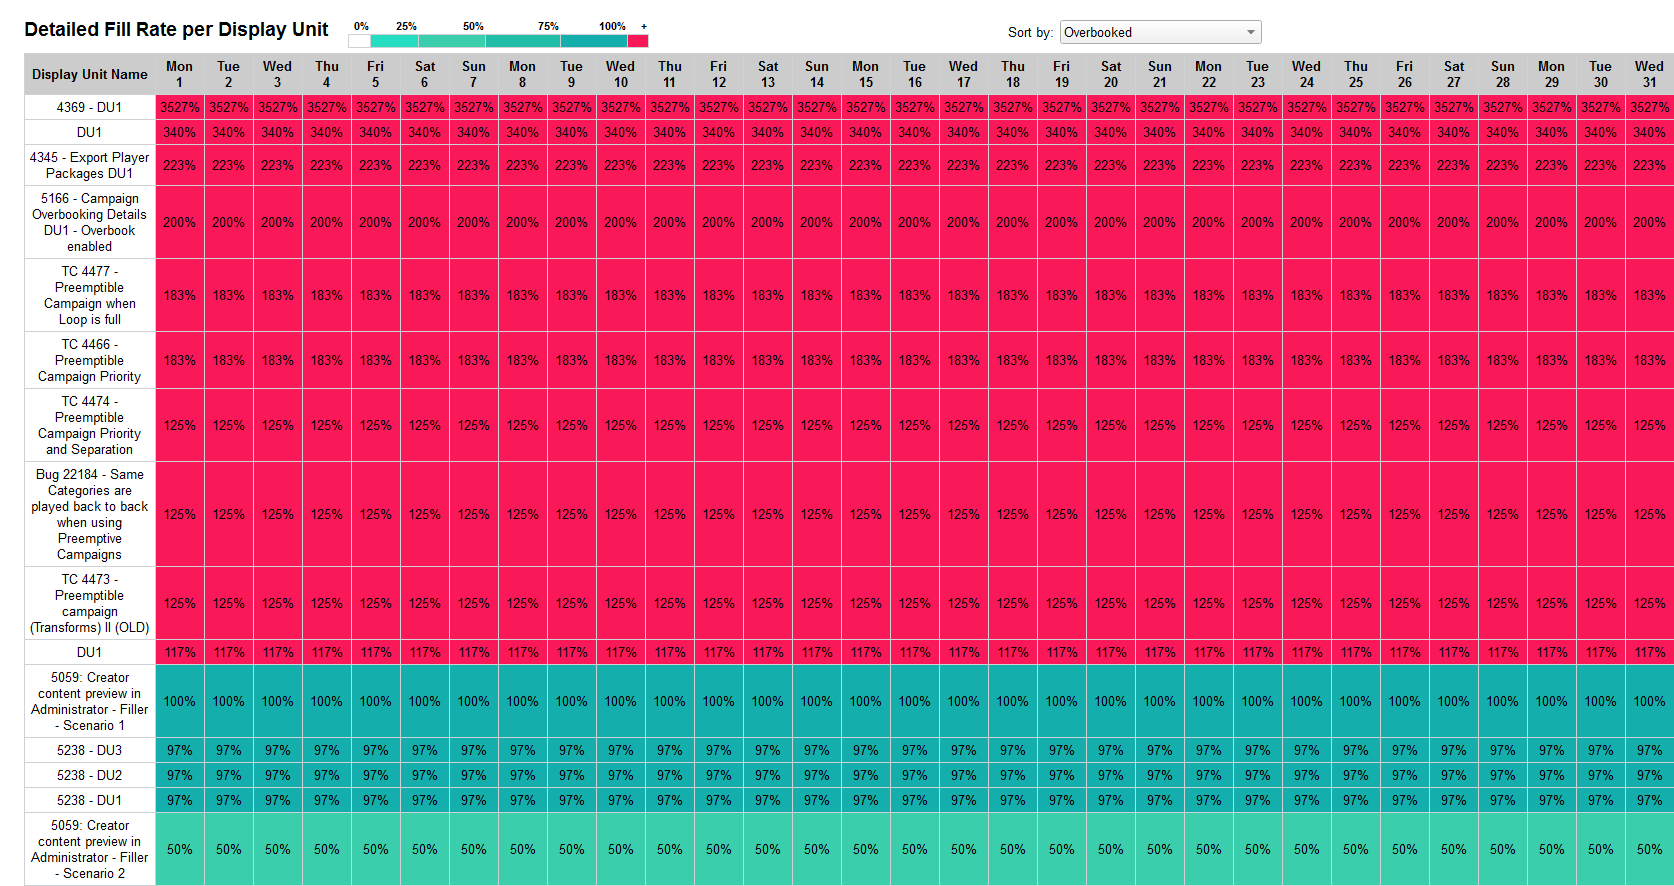
The Availability report contains several sections.
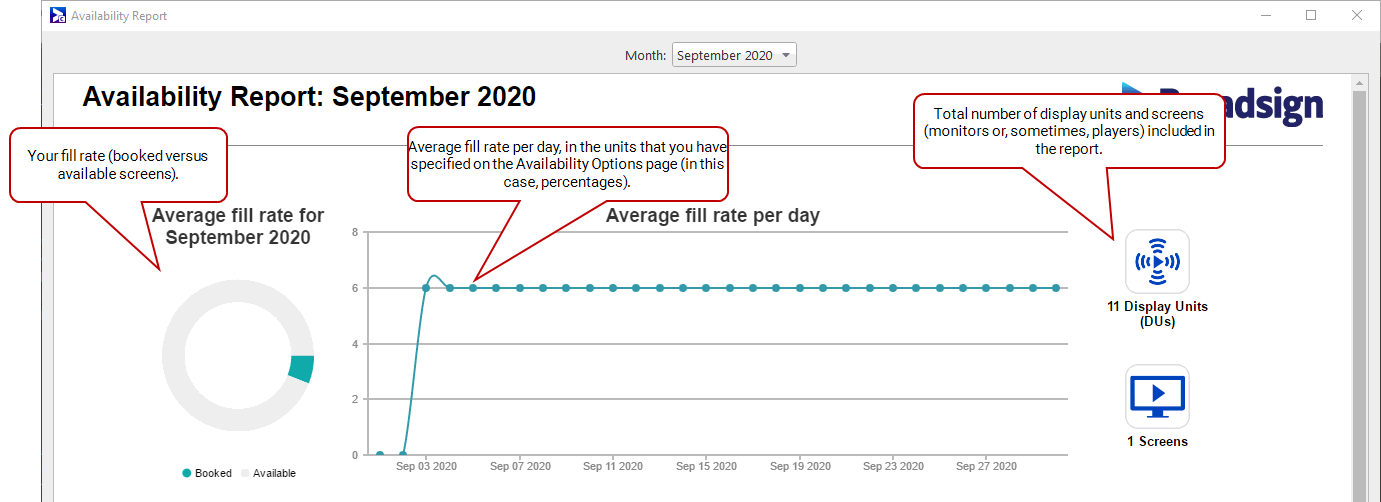
Note: Your results will appear in either percentages, minutes or slots (as you specified on the Availability Options page). See Options Page.
To set the month for which you want the report’s details, select it from the top of the report.
A pie chart displays the average fill rate for the month (that is, booked versus available screens).
A graph displays the average fill rate per day for the month.
On the right, you can see the total number of display units versus the total number of screens. Recall that one display unit could provide content to many screens (for example, a video wall).
Based on the selection you made on the Network Targeting page, you can expand or collapse the display unit folders in this section. If your report covers hundreds or thousands of display units, this feature will help you quickly focus on sections that need attention.
Select Details to populate the Detailed fill rate by display units section (see Detailed Fill Rate by Display Units).

The Availability Report provides some toolbar buttons:
- Refresh – Refreshes the data on the report, or updates it with any changes you have made to selected display units.
- Save As – Saves a copy of the report to your system.
- Find – Opens a search bar letting you search for specific content in your report (for example, display unit names or numbers, particular dates, etc.).
- Close – Closes the report.
