
The Reporting section lets you look at historical reports.
If you want to see or create scheduled reports, see Saved Reports.
Programmatic Reporting
The Reporting section provides publishers with comprehensive insights into their performance data, allowing them to analyze trends, identify areas for improvement, and ultimately optimize their content.
By utilizing the Reporting section effectively, publishers can gain a deeper understanding of their audience, content performance, and revenue streams.
This section is divided into two main parts:
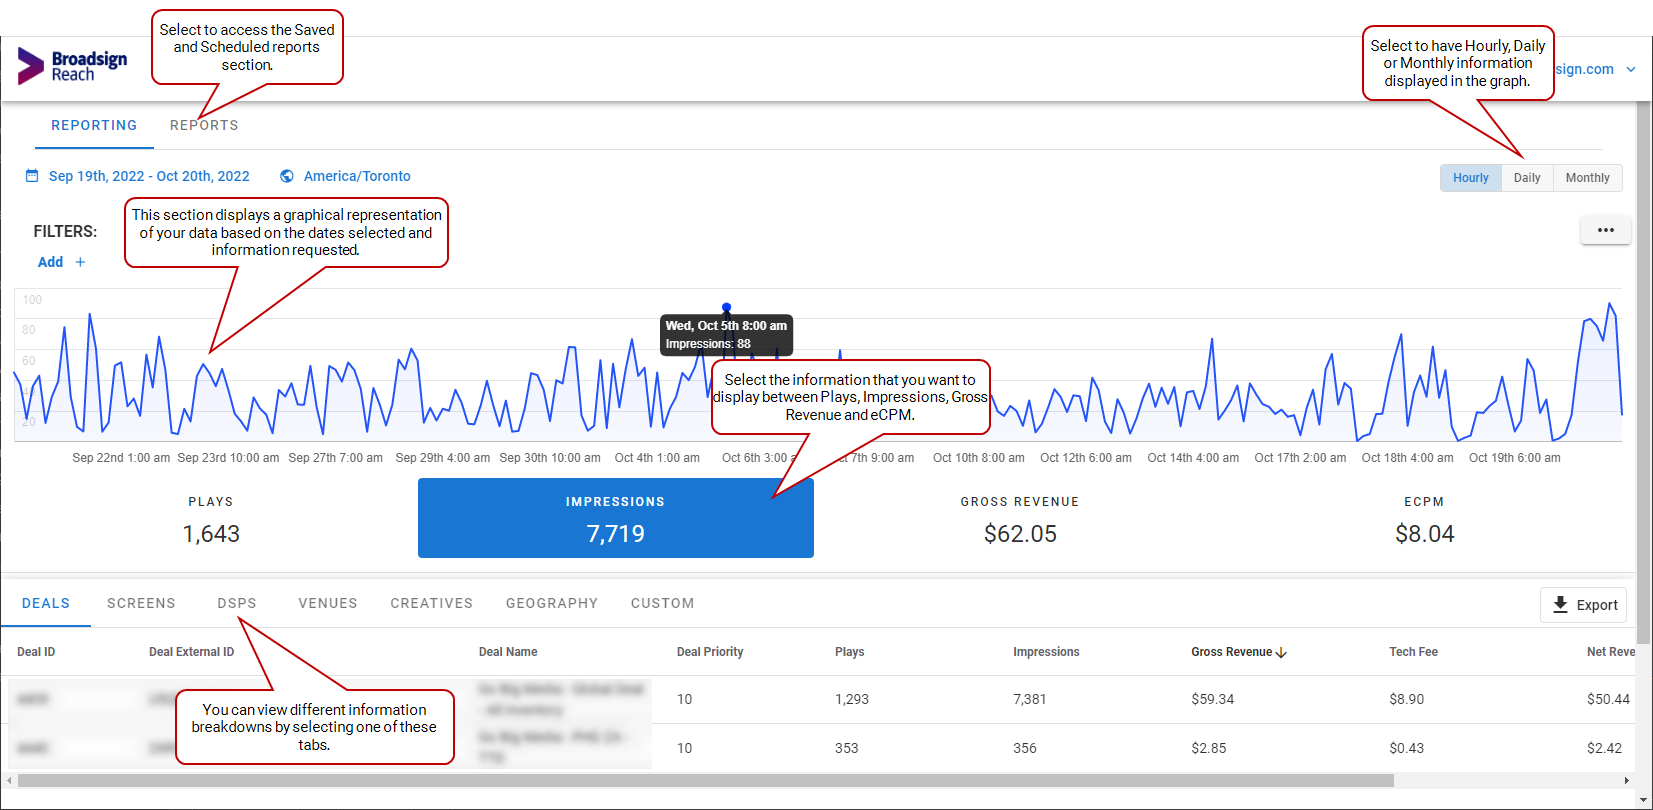
Graphical Section
This section provides a visual representation of your data, allowing you to quickly grasp key performance indicators. Features include:
- Transaction Type – Select various transaction types to display.
- Currency Type – View approximate revenue versus actual billable revenue in multiple currencies.
For more information, see (Graphical Section).
Information Section
This section offers detailed data breakdowns and filtering options. Features include:
- Access to all publisher data with precise metric breakdowns.
- Filtering options by dimensions such as deal, screen, creatives, and geography
- Predefined reporting tabs for Deals, Screens, DSPs, Venues, Creatives, and Geography
- Custom View: Create custom dashboards based on existing data
- Time zone and date reporting, including historical data.
- Saved Reports: Schedule reports for automated delivery
The Graphical section provides a visual representation of your data, allowing for quick and easy analysis of key performance indicators.
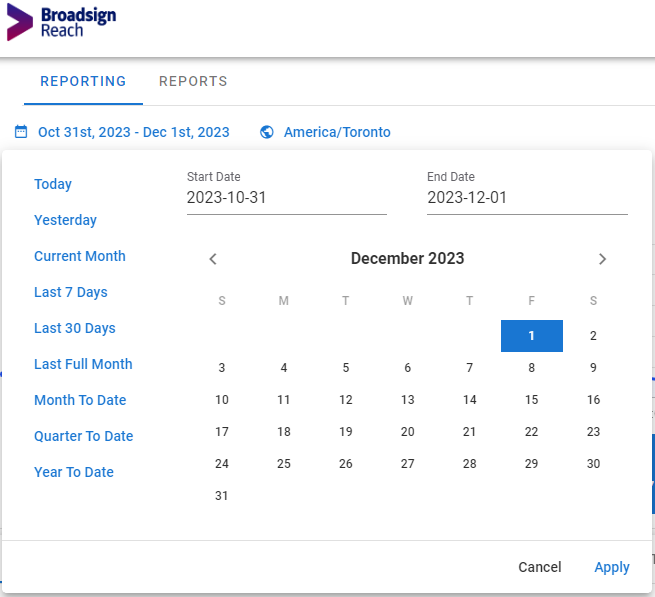
To customize the graph, use the following controls:
Select a predefined period (Today, Yesterday, Current Month, Last 7 Days, Last 30 Days, Last Full Month, Month to Date, Quarter to Date, Year to Date) or specify a custom date range using the calendar.
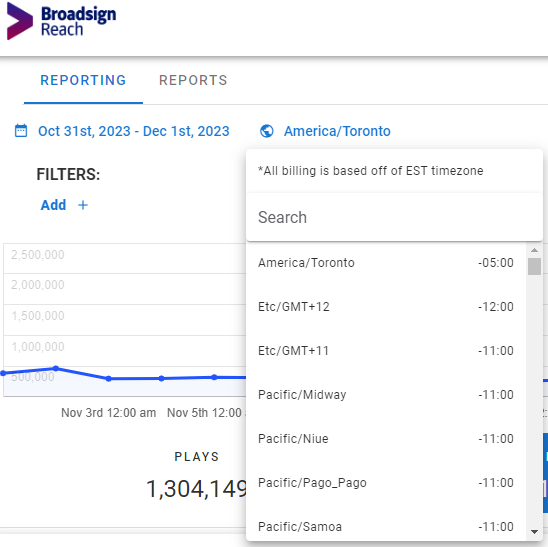
Choose the desired time zone from the list. You can search by name or time offset (e.g., "-5"). All billing is based on Eastern Standard Time (EST).
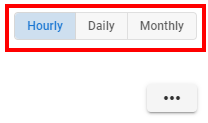
Select the level of detail for the graph:
- Hourly – Displays data on an hourly basis.
- Daily – Displays data aggregated daily.
- Monthly – Displays data aggregated monthly.
Filter the graph to display specific transaction types:
- Test – Test transaction data only.
- Billable – Production data from Broadsign SSP (Reach)-integrated demand sources.
- Ad Server – Transactions processed through Broadsign's Ad Server (if available).
- Header Bidder – Transactions processed through the Broadsign SSP (Reach) Header Bidder (if available).
- All – All available transactions.
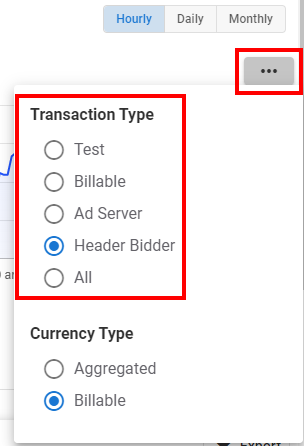
Note: Only transaction types with valid data will be listed. For example, Header Bidder is not listed in the menu if you are not using the Broadsign SSP (Reach) Header Bidder.
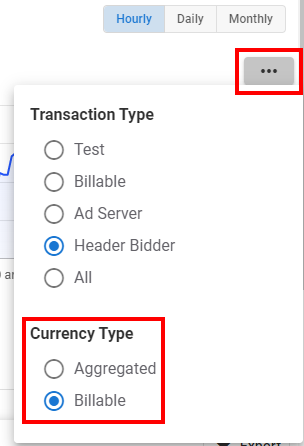
Select the desired currency for revenue metrics by clicking the ![]() icon on the right:
icon on the right:
- Aggregated: Approximate Revenue metrics in your Publisher's Primary Currency.
- Billable: Precise Revenue metrics in the specific currency (or currencies) accepted by the Publisher, used by the DSP in the bidstream.
Click on the boxes below the graph to select the information you want to visualize. Each box shows the total for the selected dates, and clicking it updates the graph accordingly.
| Information | Description |
|---|---|
|
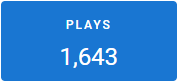
The number of times content was played and reported within the selected date range. |
|
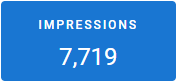
The total number of impressions delivered, calculated as plays multiplied by the impression multiplier. |
|
The total revenue generated before any deductions for the selected date range. |
|
The average of the CPM of what you are looking at. |
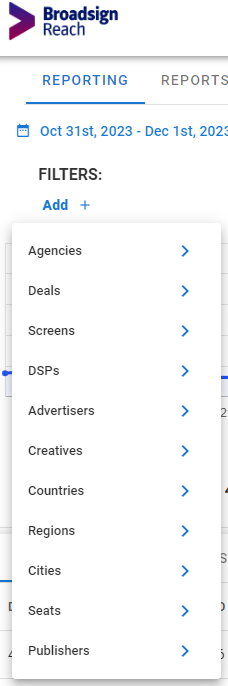
You can filter the data by using one or more of these metrics:
- Deals
- Screens
- DSPs
- Advertisers
- Creatives
- Countries
- Regions
- Cities
To add a filter to a report:
- Click the Add button next to Filter and the list of metrics is displayed.
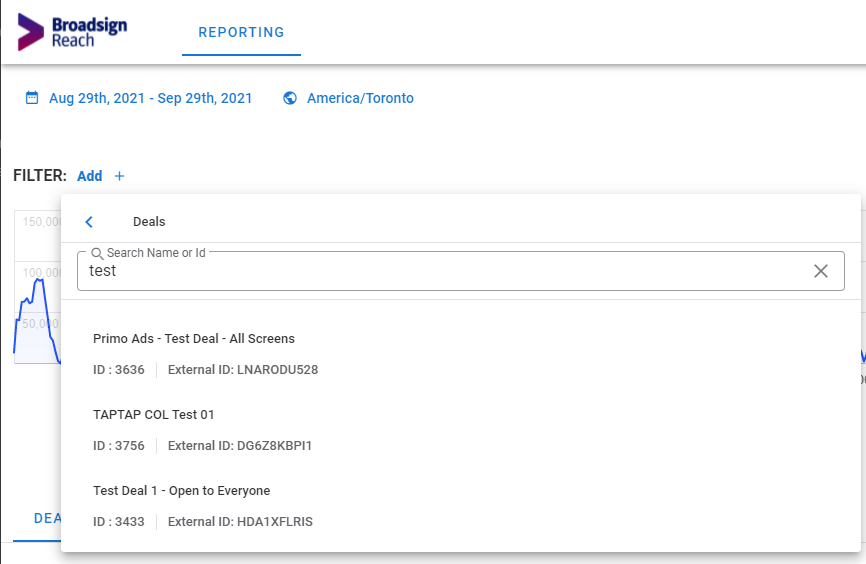
- Click one of the metrics.
- Enter the information to filter.
A search box for this specific metric is displayed. You can search by metric name or ID.
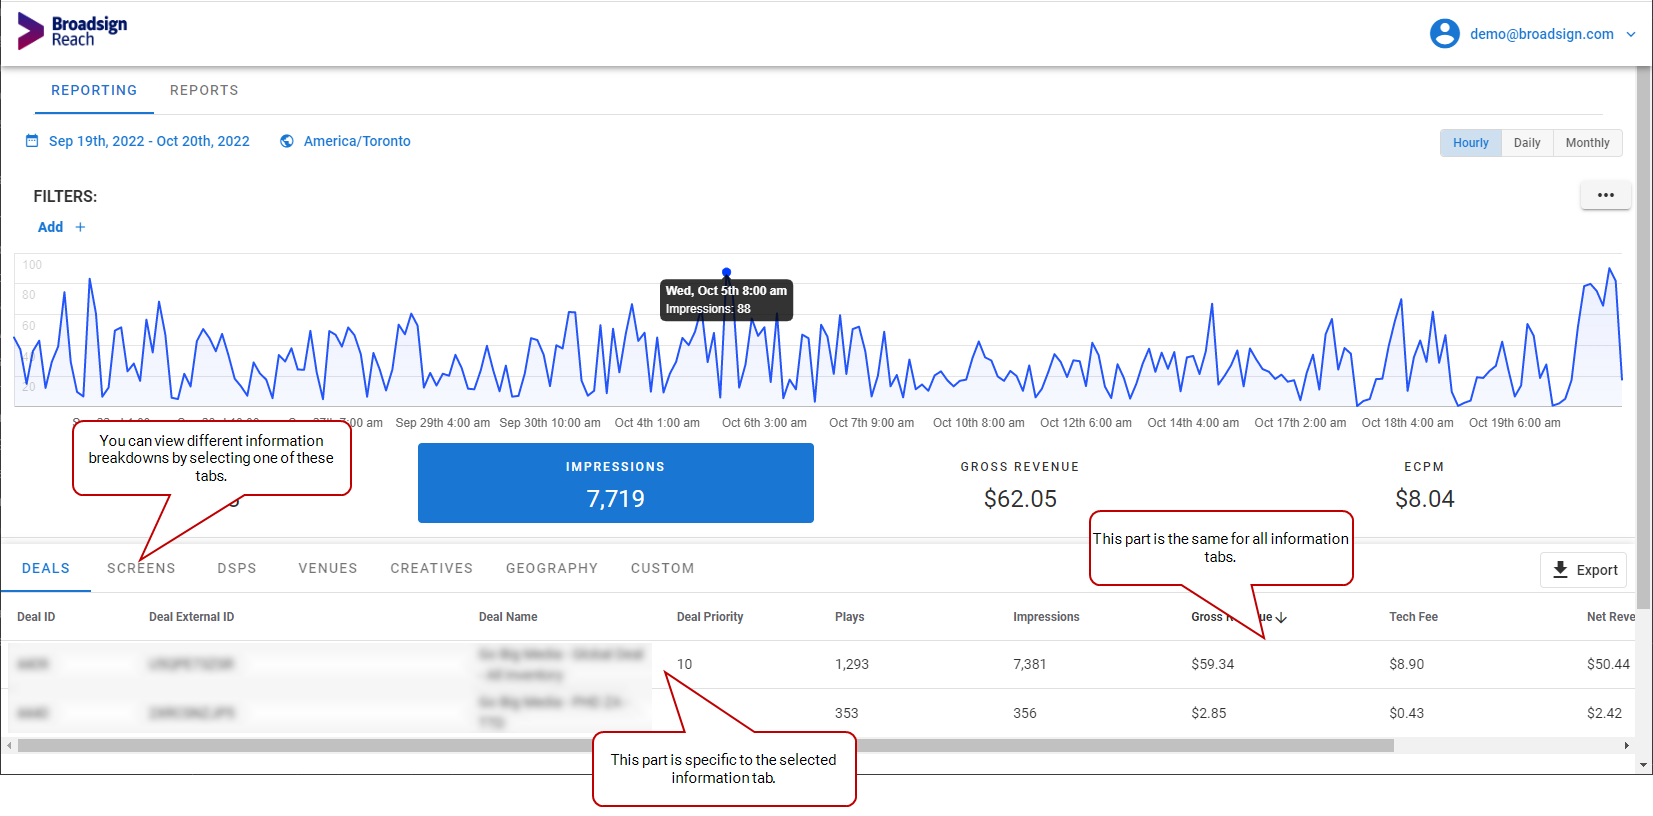
The Information section provides detailed data breakdowns for specific aspects of your reporting. You can view data for the following tabs:
- Deals
- Screens
- DSPs
- Venues
- Creatives
- Geography
- Custom
The left side of the Information section displays data relevant to the selected tab. For example, the Screens tab shows columns for Screen ID, Device ID, and Name. Each tab offers unique information tailored to its focus.
The right side of the Information section consistently displays the following performance metrics:
| Metric | Description |
|---|---|
| Plays |
The number of times content was played and reported within the selected date range. |
| Impressions |
The total number of impressions delivered, calculated as plays multiplied by the impression multiplier. |
| Gross Revenue |
The total revenue generated before any deductions for the selected date range. |
| Tech Fee | The fee charged for technology services, including exchange fees. |
| Net Revenue | The final revenue amount after deducting the Tech Fee from the Gross Revenue. |
Customize your view by sorting the data by any column. This allows you to prioritize and focus on the specific information most relevant to your needs.
You can create your own view by selecting the specific columns (Dimensions and Metrics) that you want displayed.
Tip: Once a custom view is applied, the Graphical section and Information section display information according to the custom metrics selected.
The procedure is summarized below:
To create a report custom view:
- In the Information section, click the Columns button on the right.
- Select the Dimensions and Metrics, then click Apply.
The Columns window is displayed. This window allows you to select the Dimensions and Metrics that you want in your custom view.
Tip: You must select at least one Metrics.
The selected columns are displayed.
After exploring the Reporting section, you could move on to:
