Network Health Report
The Network Health report provides a snapshot of the overall health of the network according to the business rules you have configured in your incident thresholds (see Incident Thresholds).
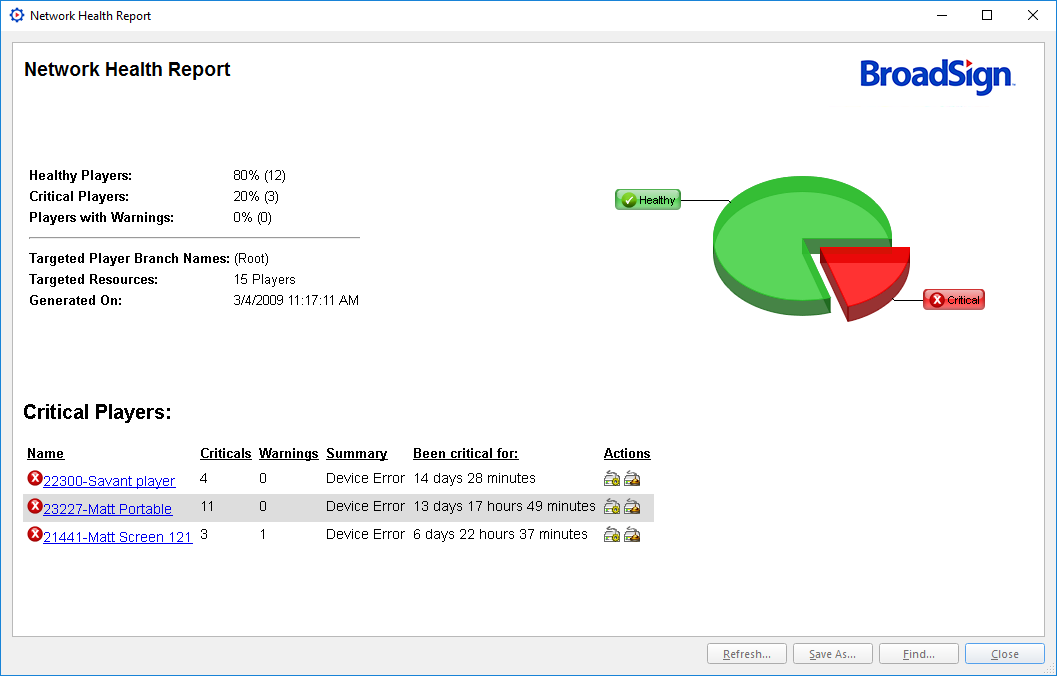
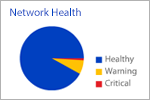
The report summarizes what percentage of your players and edge servers are Healthy, Critical or in Warning status.
To generate the network health report:
Use one of the following methods:
-
Go to the Operations ribbon, and click on the Network Health icon.
-
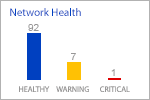
From the dashboard, in the Network Health widget, click on a bar (in the bar graph) or a pie section (in the pie chart).
-
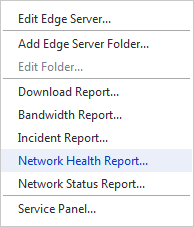
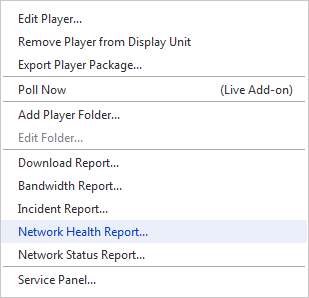
From the resource tabs on the left, select Edge Servers or Players. Then right-click anywhere in the work area. From the contextual menu, select Network Health Report.
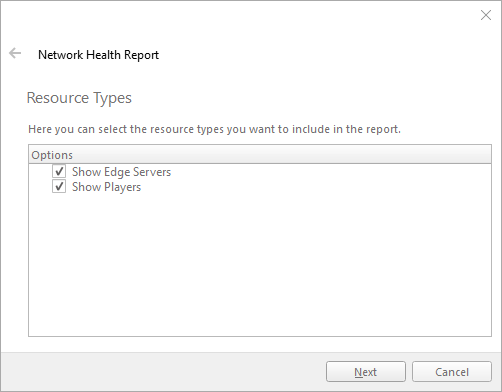
If you generate the report by selecting the Network Health icon from the Operations ribbon, you will need to input information into the following pages:
-
Resource Types – Select the resource types you want to include in the report: edge servers or players.
-
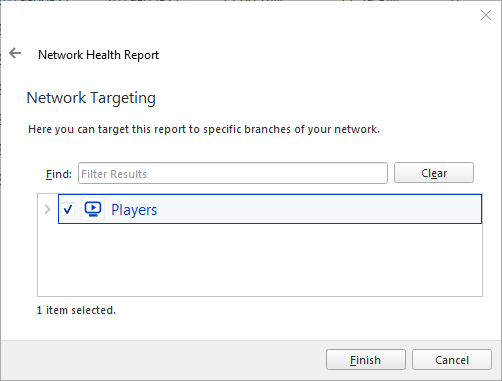
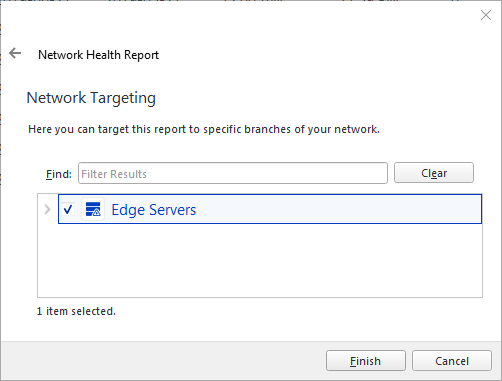
Network Targeting – Target the report to specific branches of your network.
Note: You must configure your tolerance levels for particular incident types using incident thresholds. If no incident thresholds are configured, every incident will be considered as trivial and the network health report will always say indicate that your players are 100% healthy. For more information, see Incident Thresholds.
The pie chart summarizes what percentage of your players and edge servers are healthy, critical or in warning status.
Below you will find a list of all critical players or edge servers, followed by those with warnings. Clicking on a player or edge server’s name in the report will find and show the resource in Broadsign Control Administrator’s content pane. Each resource will also indicate how many critical and warning incidents are currently open, a summary of the most pressing issue and an indication of how long it has had a status of Critical or Warning. The Actions column provides two quick links to help with troubleshooting. The first link leads directly to the resource’s properties dialog, whereas the second link will immediately open the Service Panel for that resource.
Keeping a close eye on the health of your network is critical in extracting the maximum value out of your deployed network. In that respect, the list of critical players that this report generates should be interpreted as your “TO-DO” list to keep your network running a peak efficiency.
Note: In general, lost connectivity is the most severe problem; therefore, MIA incidents trump all other incidents.
Other open incidents have no real value until the MIA is resolved. They may already be resolved but the player cannot report them.
Example: If a player has two warnings, one Missing Ad Copy open for 3 hours and one MIA open for 2 hours, the player would show up in the warnings section and the summary would be: Warnings=2, Summary=MIA, Been warning for: 3 hours.
Example: If a player has one Critical (Missing Ad Copy, 48 hours) and one Warning (MIA, 5 hours), the player would show up in the Critical section and the summary would be: Critical=1, Warnings=1, Summary=MIA, Been critical for: 48 hours.
Example: If a player has two Criticals (Missing Ad Copy, 48 hours) and (MIA, 25 hours), the player would show up in the Critical section and the summary would be: Critical=2, Warnings=0, Summary=MIA, Been critical for: 48 hours.
Note: You must configure your tolerance levels for particular incident types using incident thresholds. If no incident thresholds are configured, every incident will be considered as trivial and the network health report will always say indicate that your players are 100% healthy. For more information, see Incident Thresholds.
