 minute read
Gain insight on revenue, delivery and troubleshoot problems.

Available reports include:
- Revenue Summary
- Revenue By Day
- Revenue Breakout
- Inventory Health
- Deal Monitoring
- Campaign Troubleshooting
- Delivery Overview
Most reports allow you to "drill into" data. When you click a metric column in a reporting view, the system "drills into" the data and presents a summary of the underlying information, split by a default set of fields.
You can use this feature to find the underlying cause of a specific metric. For example, you can view which adunits contribute to the adrequests generated against a particular deal.

At the top of each view, you can find filters for dates, deal tokens, deal IDs, advertisers (adomain), and currency. The Currency filter displays only your organization's default currency.
To apply filters:
- Configure the filters you want to apply.
- Click the "refresh" icon.
In addition to standard filters that limit results to configured dates and deal tokens, certain reports, such as the Revenue Breakout report, include a Group By filter. The Group By drop-down menu does not restrict results like standard filters. Instead, it alters the table columns to group your data. This allows you to quickly switch between different data groupings, such as revenue by DMA or revenue by Deal.
Generating reports for larger date ranges takes more time to return data.
All text-based searches and filters are case-insensitive and ignore letter case. For example, searching for the deal token "awesome-deal-token", "Awesome-Deal-Token", or "AWESOME-DEAL-TOKEN" returns the exact same result.
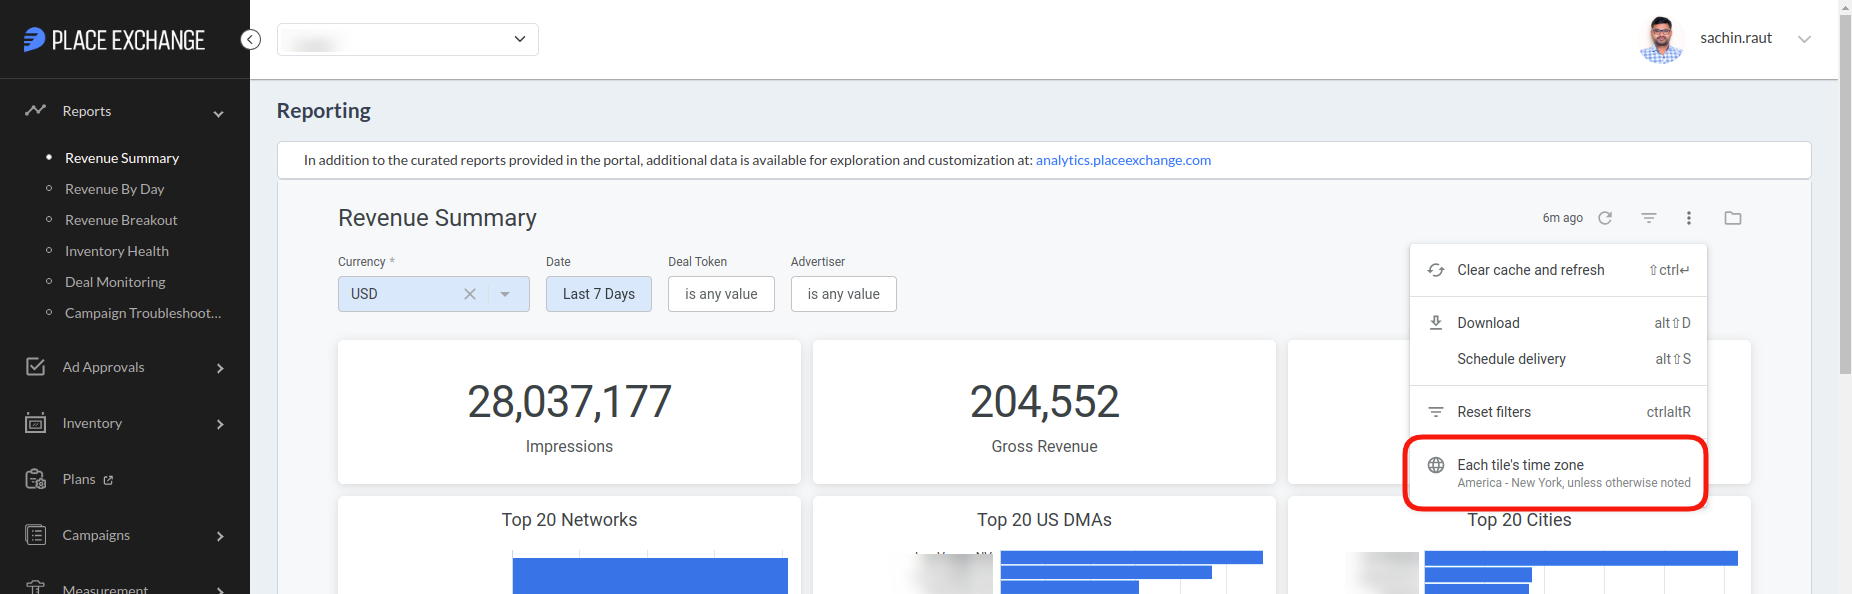
By default, reports use the "America/New_York" time zone. You can change reports to other time zones through the Options menu in the upper-right corner.

You can download data for additional analysis. To do so, click the Options drop-down menu and select Download.
If a dashboard contains multiple datasets, the system downloads a ZIP file containing a separate file for each tile to your computer. When you download reports, select "All results" to prevent the system from limiting your download to 5,000 results.
Revenue Summary Report
Place Exchange
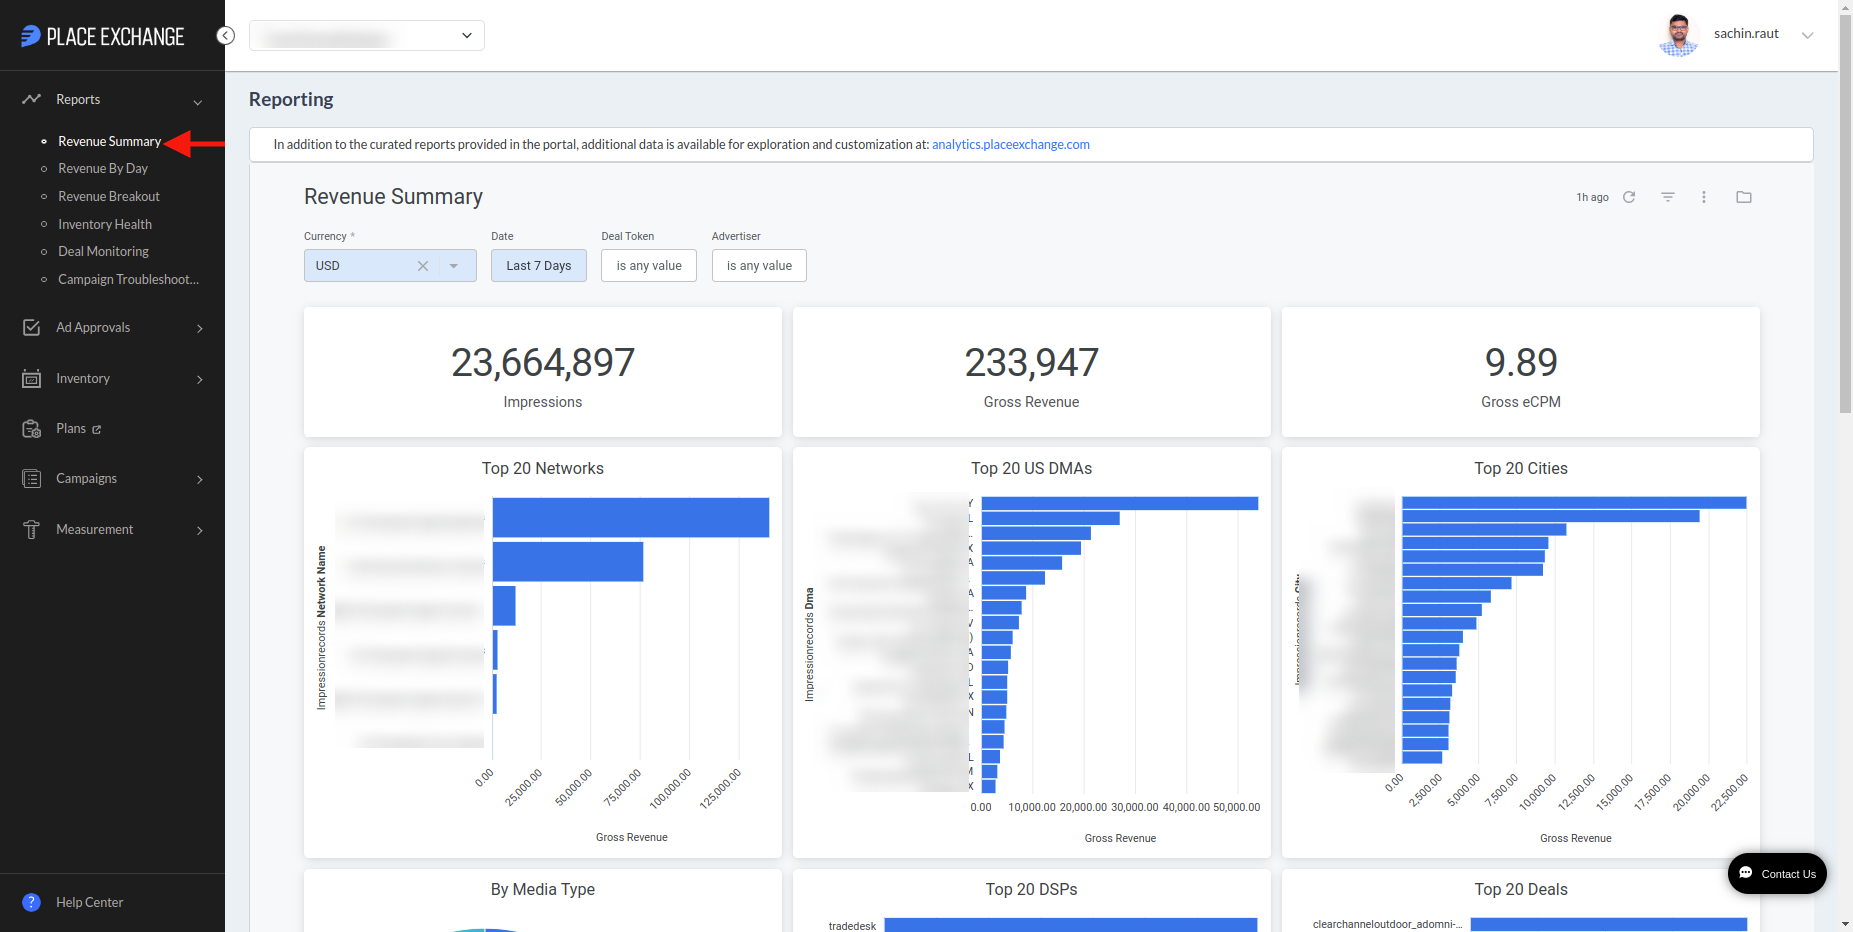
The Revenue Summary dashboard provides a high level view of the revenue generated through Place Exchange. Available metrics include impressions served, gross revenue (before fees), and Gross eCPM.
Unless otherwise noted, revenue reflects total auction value, including Tech Fees paid to Place Exchange.
For information about the Net Revenue or Net eCPM metrics, refer to the Revenue By Day tile in the Revenue By Day report.
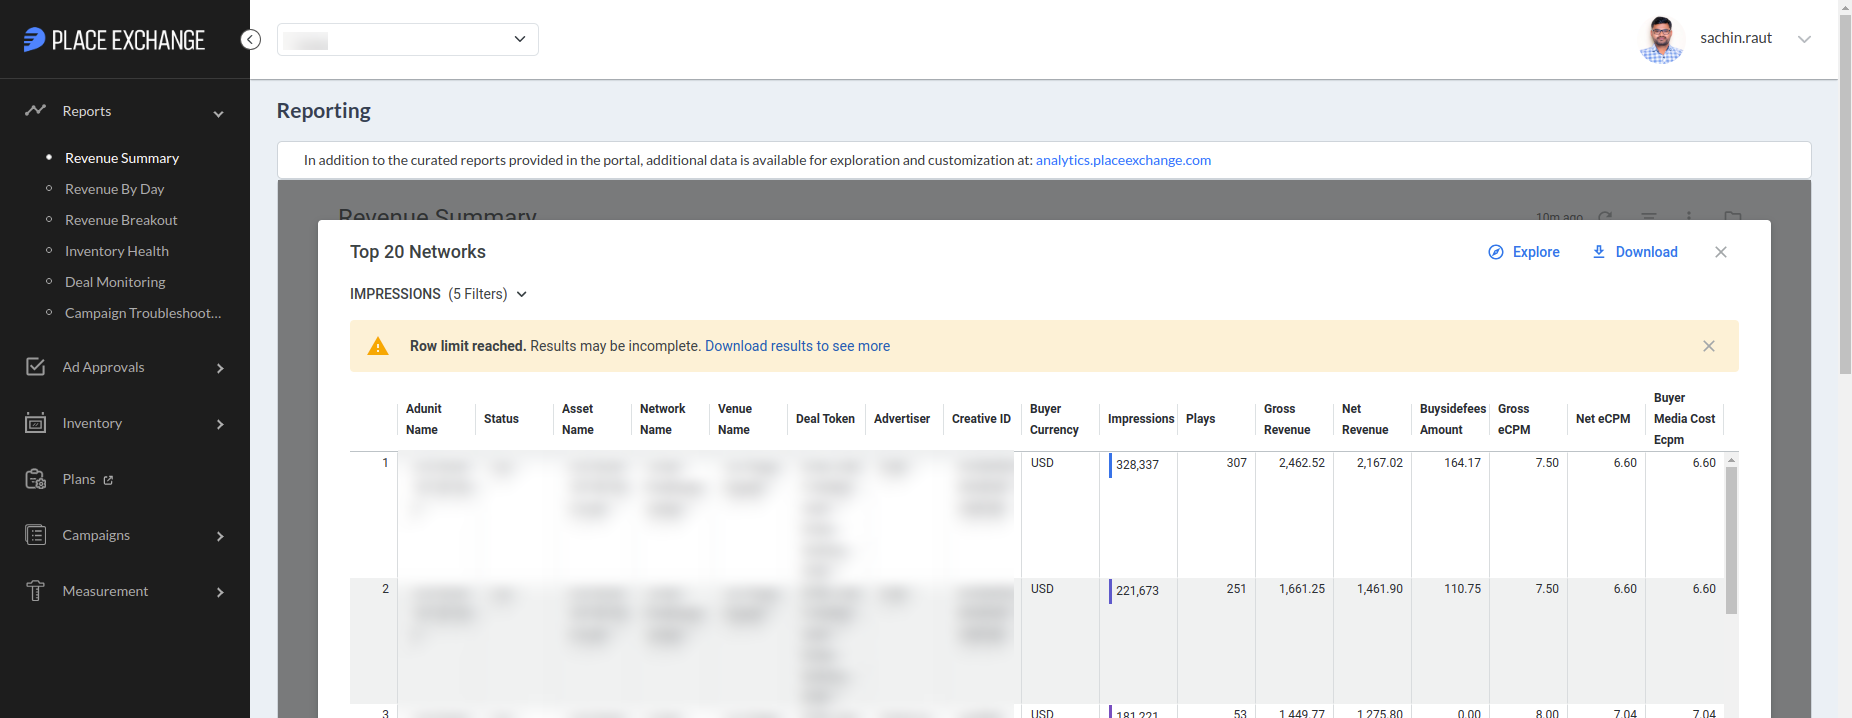
For more detail, such as to view splits across deals, advertisers, payments, fees, and eCPMs, click on individual values or graph elements for a detailed “drill down” view.
If you don't see any reporting data, check the default filters to make sure the correct values have been selected.
To view revenue data in a different currency, adjust the Currency filter (for example, select CAD for Canadian transactions).
To download the complete report, click the three-dot menu. You can also download data for individual dashboard tiles.
Revenue by Day Report
Place Exchange

The Revenue by Day dashboard shows trends in your revenue over time. It has two main sections:
- Revenue Paid By Place Exchange – Shows data for media transactions paid directly by Place Exchange.
- Revenue Paid By Resellers – Shows data for media transactions paid by Resellers (Third party payers).

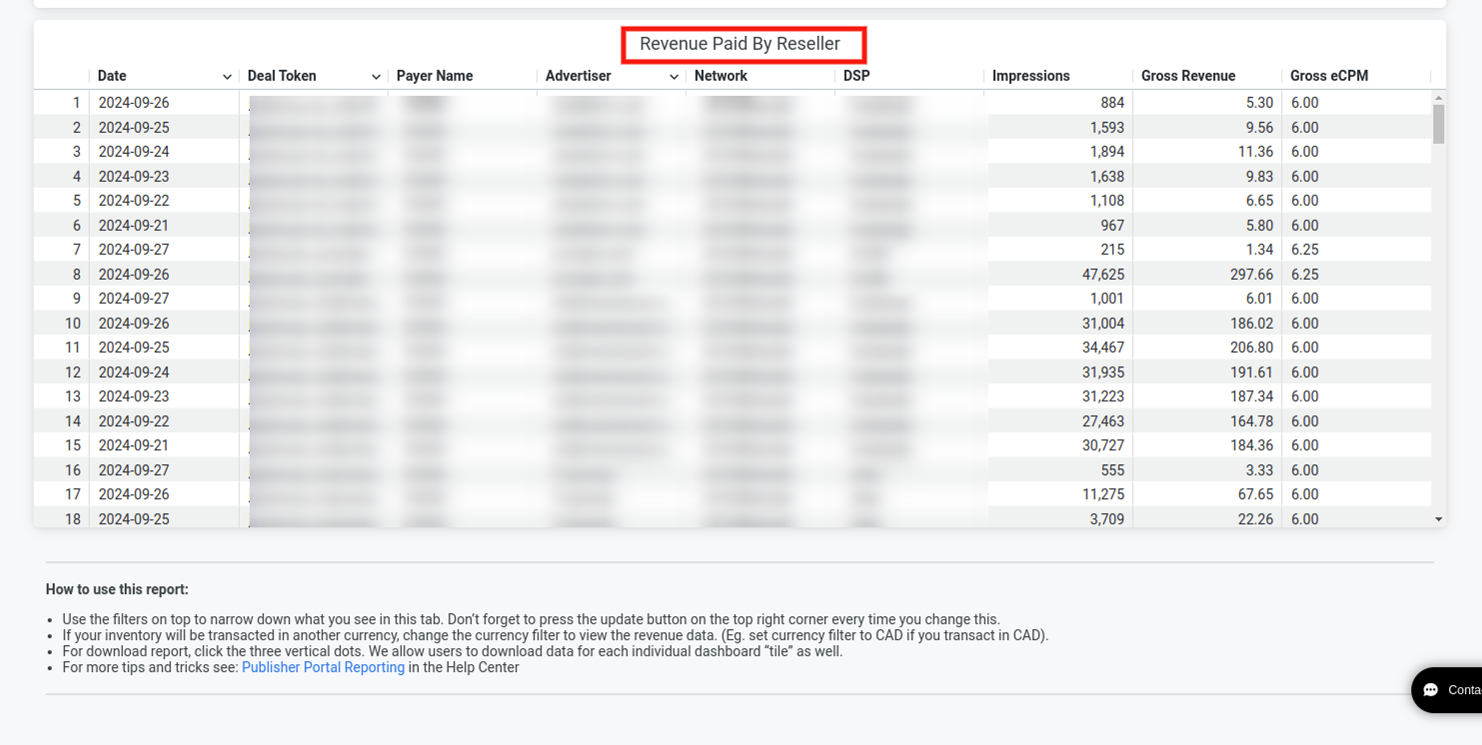
Use the filters at the top of the page to refine the report data. Click the Update button in the top-right corner after you change any filter.
To view revenue data in a different currency, adjust the Currency filter (for example, select CAD for Canadian transactions).
To download the complete report, click the three-dot menu. You can also download data for individual dashboard tiles.
Revenue Breakout Report
Place Exchange

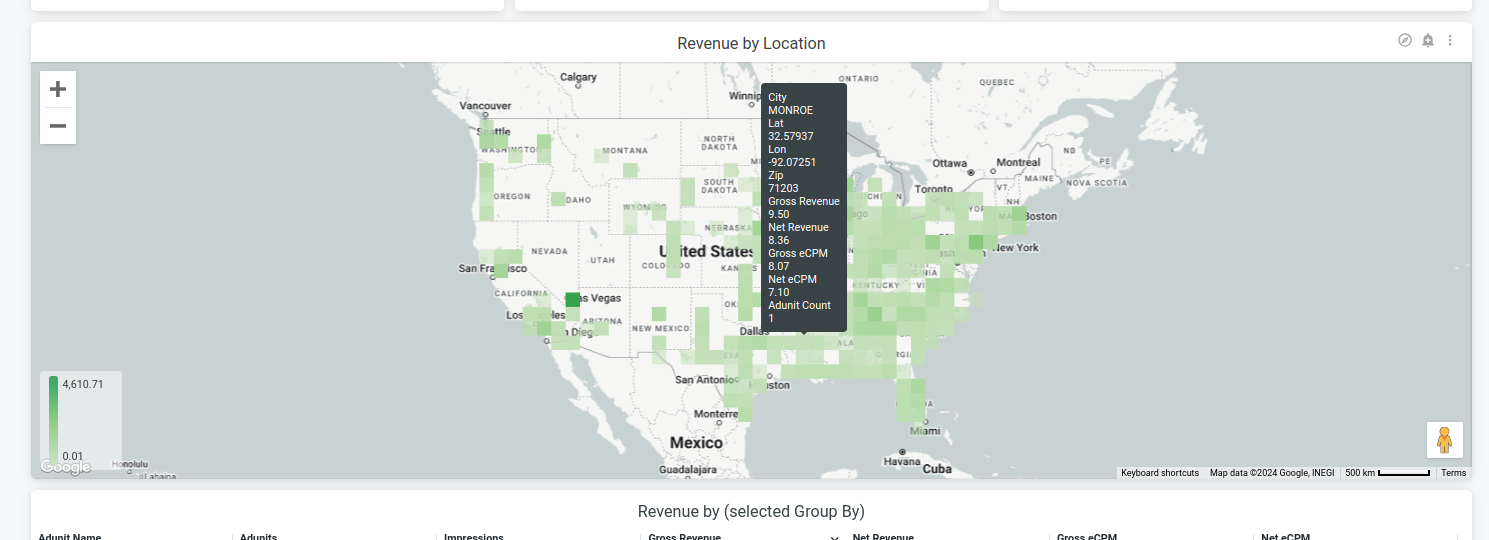
The Revenue Breakout dashboard provides the revenue split based on different dimentions succh as Adunit Name, Asset Name, Advertiser, City, Deal Name, DMA, DSP, Network Name and Venue Name. Available metrics include impressions served, gross revenue, net revenue, Gross eCPM and Net eCPM. It has two main sections:
- Revenue by (selected Group By) – Shows the revenue data based on the selected Group By filter.
- Revenue by locations – Shows the locations of the adunits on a map view, on hovering over the locations shows detailed information.

Clicking the Group By filter displays all of the available dimensions that you can use to group the data:

Clicking on an individual tile or graph will "drill-in" to the values driving that statistic.

Use the filters at the top of the page to refine the report data. Click the Update button in the top-right corner after you change any filter.
To view revenue data in a different currency, adjust the Currency filter (for example, select CAD for Canadian transactions).
Each tile limits results displayed to 5000 rows. If you have more than 5,000 adunits, download a report of the full set by clicking the three vertical dots (top right of each tile when hovering) to download up to 100,000 rows via the custom option.
Inventory Health Report
Place Exchange

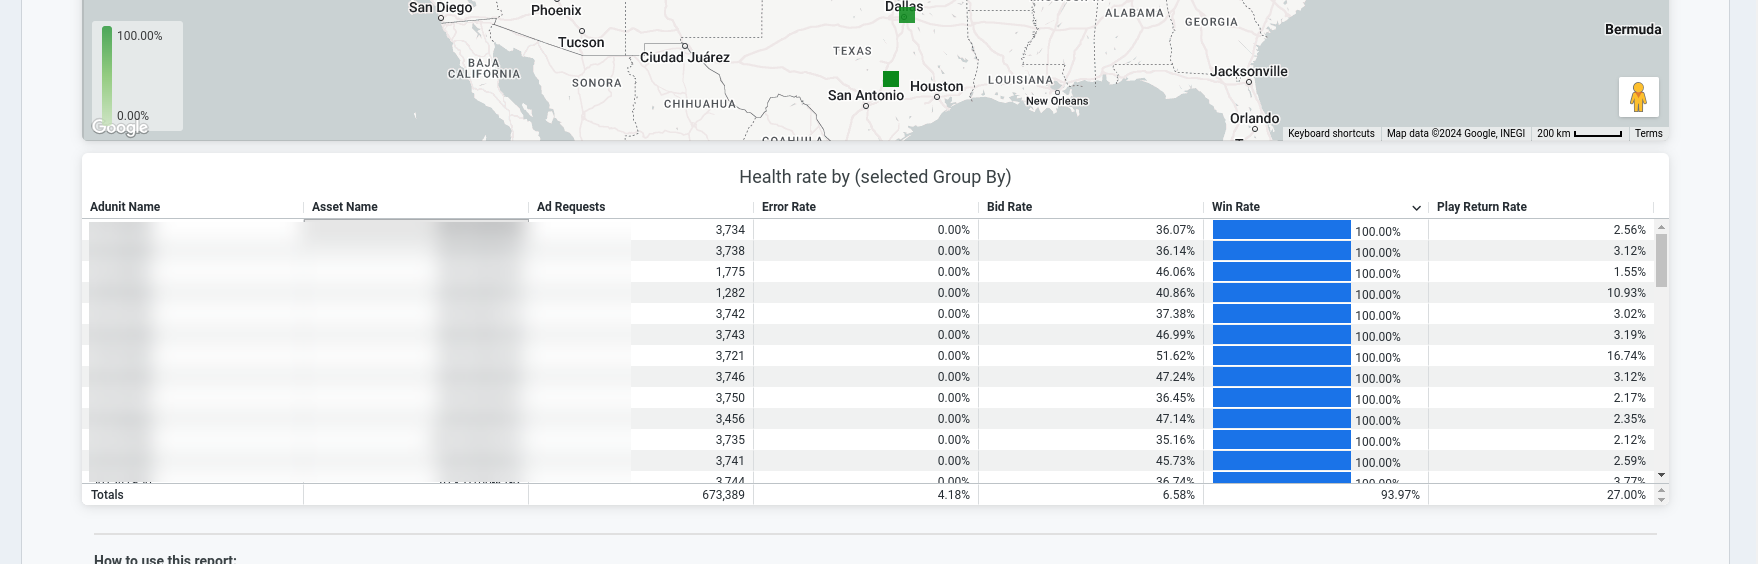
The Inventory Health dashboard provides request and transaction metrics that give a view into inventory health (for example, ad request volume, errors, wins, play return rate). The metrics can be aggregated at the ad units level, asset level or at the network level.
- Health rate by (selected Group By) – Shows the ratios, such as error rate, bid rate, win rate, and play return rate, based on total request data based on the selected Group By filter.
- Drill down view – More information (drill down fields) is available by clicking on individual row.
Clicking the Group By filter displays all of the available dimensions that you can use to group the data:


Metrics Definitions:
| Metric | Definition |
|---|---|
| Ad Request Count | Total number of ad requests for filters applied. |
| Ad units w/ Ad Request | Number of Ad units which sent ad requests for filters applied. |
| Error Rate | Percentage of ad requests received that are erroring out. |
| Play Return Rate | Percentage of plays with respect to Place Exchange auction wins. |
| Bid Rate | Percentage of valid ad requests that have bids. |
| Win Rate | Percentage of Bids that win auctions. |
Note: This dashboard displays data after 1st Dec 2022 and you should expect a 2 to 3 hours delay between completing deal and placement setup, seeing requests and getting accurate play return rates in this report.
Use the filters at the top of the page to refine the report data. Click the Update button in the top-right corner after you change any filter.
Each tile limits results displayed to 5000 rows. If you have more than 5,000 adunits, download a report of the full set by clicking the three vertical dots (top right of each tile when hovering) to download up to 100,000 rows via the custom option.
Deal Monitoring Report
Place Exchange

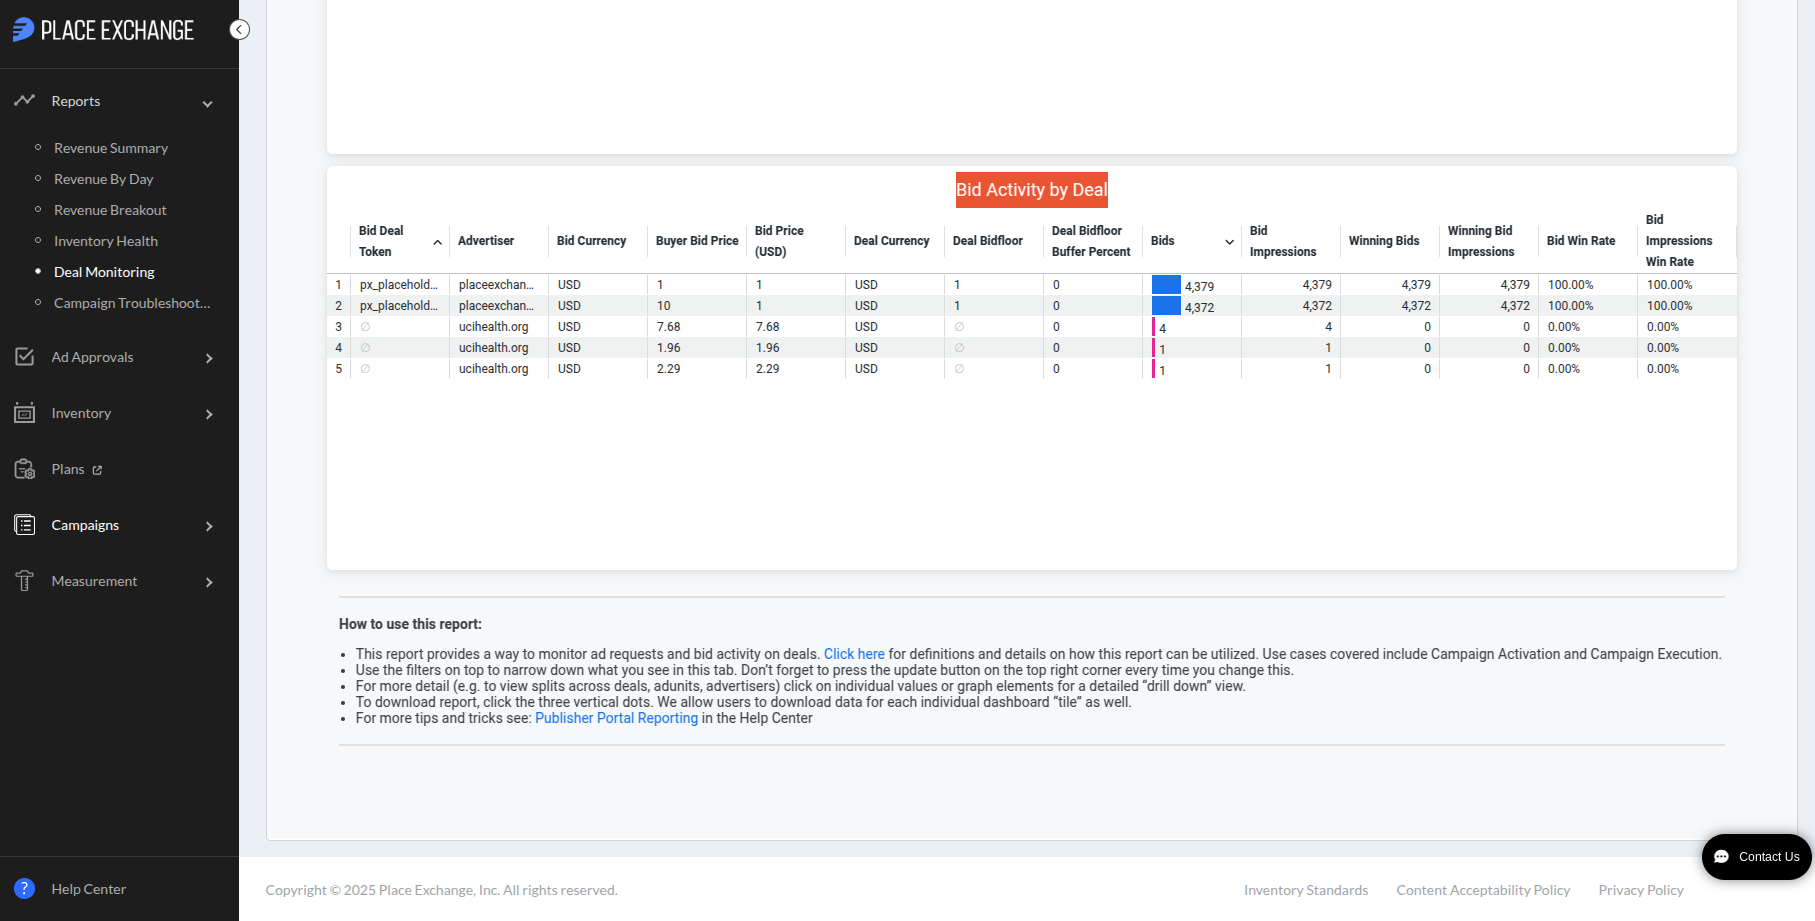
The Deal Monitoring dashboard tracks deal request and bid activity data to support users during campaign activation and execution.
- Ad Request Activity by Deal – Displays supply information, bid metrics, and win metrics.
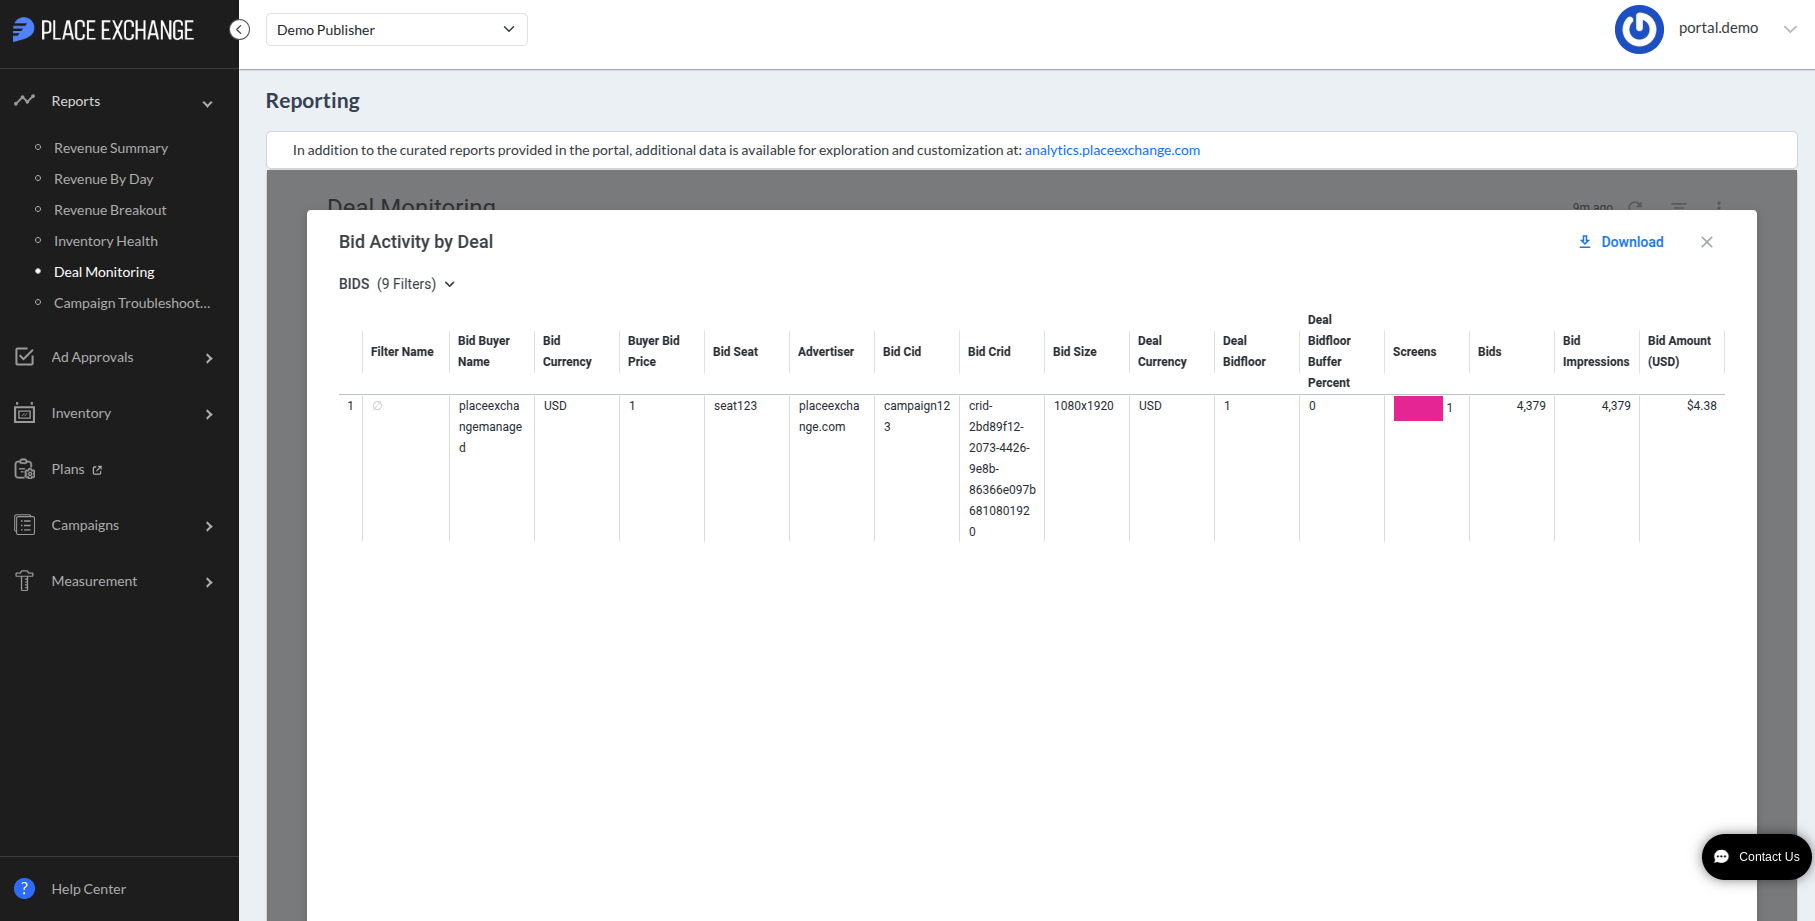
- Bid Activity by Deal – Details specific bid data and tracks the individual advertisers bidding on the deal.
Watch this video for an overview of this report.
Use the filters at the top of the page to refine the report data. Click the Update button in the top-right corner after you change any filter.
For more detail, such as to view splits across deals, adunits, or advertisers, click on individual values or graph elements for a detailed “drill down” view.
To download the complete report, click the three-dot menu. You can also download data for individual dashboard tiles.
Watch this video for a demonstration of how you can use the Deal Monitoring report when activating campaigns:
After you configure and associate a deal with inventory, check the deal token in the Ad Request Activity by Deal table to verify incoming requests.
If you map multiple deals to the same token, click the Ad Requests value to view the specific requests for each deal.
Allow up to 30 minutes after configuration for requests to appear in the report.
If you do not see any requests, check for the following:
- Verify that you associated the deal with the inventory. If you perform this action inPlace Exchange, look for a corresponding placement in the Deals section of the portal. If you configure the inventory in your ad server, verify completion of this step.
- After you associate the deal with the inventory, confirm that your targeted
adunitsactively send requests.
After the buyer launches the campaign, you will begin to view bid activity and subsequent wins.
To monitor an always-on deal, review the Bid Activity by Deal table for specific advertiser data.
If the dashboard displays bids but no wins, drill into the bids value for the deal-advertiser combination to determine why the system filtered the bids.
Review the following side-by-side fields and rejection reasons to quickly identify if demand-side platforms (DSPs) lose bids due to pricing:
The below fields side by side combined with rejection reasons can help to identify faster if bids submitted by DSPs are losing because of price:
| Metric | Description |
|---|---|
| Deal Currency | The currency for the deal, the contract deal between the publisher and the buyer. |
| Deal Bid Floor | The bid floor for the deal. |
| Deal Bid Floor Buffer Percentage | The allowable percentage below the bid floor at which a bid can participate in the auction. |
| Buyer Bid Price | The bid price in CPM, represented in the buyer's currency. |
| Buyer Bid Currency | The currency of the buyer as specified in the bid response. |
Watch this video for a demonstration of how you can use the Deal Monitoring report when troubleshooting live campaigns:
Monitor the Ad Request Activity by Deal table for changes in Error Rate and Fill Rate. You can expect changes in these metrics during campaign launches or closures, when you modify available deal supply, or when the buyer alters campaign targeting criteria.
If none of these scenarios apply, drill into each deal to identify which ad unit caused the delivery change.
Unless you modify the associated inventory, the ad request count remains consistent throughout the campaign lifecycle.
- If you notice unexpected fluctuations in the request count, verify your expected ad unit count. If the Ad Unit value appears incorrect, ensure no one altered the deal's associated inventory.
- Select the Ad Unit value to view the specific ad units requesting this deal. Review the Error: Invalid Requests field to determine if any ad units fail unexpectedly.
Campaign Troubleshooting Report
Place Exchange
The Campaign Troubleshooting dashboard assists users in investigating and understanding why bids may be rejected or filtered. Publishers can:
- Visualize rejected bids over the course of the day. Entries containing 'Ø' indicate Bids that were not rejected.
- Analyze the breakout of advertisers' bid results against specific deals. Drill into the bids value for the deal-advertiser combination to see if bids have been filtered out for some reason.


The below fields side by side combined with rejection reasons can help to identify faster if bids submitted by DSPs are losing because of price:
| Metric | Description |
|---|---|
| Deal Currency | The currency for the deal, the contract deal between the publisher and the buyer. |
| Deal Bid Floor | The bid floor for the deal. |
| Deal Bid Floor Buffer Percentage | The allowable percentage below the bid floor at which a bid can participate in the auction. |
| Buyer Bid Price | The bid price in CPM, represented in the buyer's currency. |
| Buyer Bid Currency | The currency of the buyer as specified in the bid response. |

The report includes some common campaign issues and potential resolutions at the bottom. To troubleshoot other issues that you might observe, contact help@placeexchange.com or your Partnership Manager.
The Edit Placement page features the Delivery Overview dashboard. This dashboard tracks how a placement performs against its specific goals.
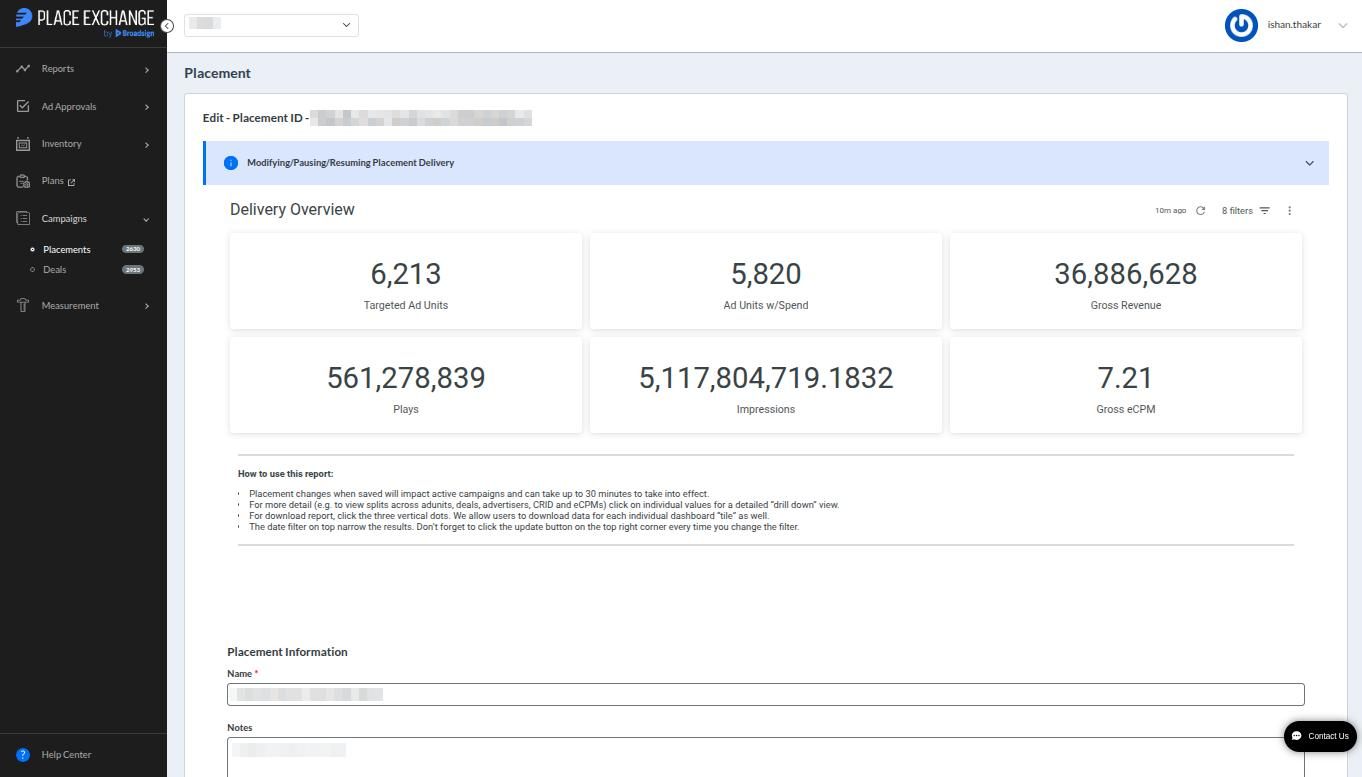
Metrics
The following metrics are available:
| Metric | Description |
|---|---|
|
|
Tracks the total count of Ad Units the placement targets. Note: The Targeted Ad Units metric excludes specifically selected Ad Units. Instead, the dashboard aggregates data based on all other active filters. |
|
|
Identifies targeted Ad Units that register active spending. |
|
|
Totals the revenue generated during the selected date range. |
|
|
Counts all plays reported within the selected date range. |
|
|
Calculates delivered impressions by applying the impression multiplier to the total play count for the selected date range. |

|
Measures the gross effective cost per thousand impressions for the selected data. |


Drill Downs
The Portal offers different options to drill down into the specific values driving that statistic:
- Select an individual tile to drill down into the specific values driving that statistic. For example, clicking the Targeted Ad Units tile displays a list of the first 500 units. To access the entire drill downs data, download the complete file.
- Click the Explore from Here icon of the tile. This brings you to the Explore view, where you can get detailed custom insights into the values. For more information, see Creating and Managing Custom Reports with Explore.
- To download the report the entire drill downs data, click the three vertical dots and select Download data.
- Narrow your results using the Date Filter located in the top right corner. Select the Update button after every filter change to refresh the dashboard data. For more details, see Filter Reports & "Group By".

![]()
![]()

This generally means that either you are trying to pull a lot of data at once, or there are multiple users from your organization accessing reports at the same time. To resolve this issue, either update the Date filter to a smaller range, or retry after some time. If the issue still persists, contact your Partnership Manager or email help@placeexchange.com.
The Play Return Rate measures the percentage of winning bids that successfully return a confirmed play notification from the publisher. This calculation includes only the bids that win the Place Exchange auction and which the system subsequently passes to the publisher as ad responses.
After publishers win a Place Exchange auction and receive an ad response, they must play the ad and send a play notification to the platform. The system uses these play notifications to process and issue publisher payouts for the displayed ads.
This simplified illustration demonstrates the interactions between publisher systems, the Place Exchange platform, and the Demand-Side Platform (DSP).
| Term | Description |
|---|---|
| Adrequest | A request from the Publisher that signals an opportunity to play an ad on that ad unit. |
| Bidrequest | A request to the DSP with details of the inventory and deals (when applicable) on which they can bid. |
| Bidresponse | A response from the DSP that indicates that the bidrequest meets an advertiser’s criteria for an ad campaign, and includes details about the campaign. |
| Adresponse | The system sends this response to the Publisher to indicate that an auction resulted in a winning bid. This response contains the ad creative that the Publisher displays on their screens. |
| Play | See above. |
| Win | The system sends this notification to the DSP to indicate that they have a winning bid and that the ad has been played. |
When Publishers unify demand from multiple sources or run internal campaigns that compete with Place Exchange programmatic ad responses, the play return rate naturally falls below 100%.
Conversely, Publishers relying exclusively on Place Exchange demand should maintain a play return rate at or near 100%. Occasional network issues might cause minor, temporary drops to approximately 99%. These minor fluctuations require no administrative action unless the degradation persists.
During troubleshooting, administrators can evaluate the Week Over Week (WoW) change in the play return rate to identify potential system issues quickly.
Publishers must check a few areas within their internal systems:
- Demand Unification/Secondary auction – If they are participating in another SSP’s mediation solution, or running a secondary auction, a winning Place Exchange deal might lose the downstream auction. As a result, the play return rates within Place Exchange drops. While this explains the lower play return rate, it is important that the Publisher aligns the drop with wins downstream to ensure no other issue is causing the drop. In addition, if there is a large drop or Place Exchange is consistently losing, there is an opportunity to have the buyer increase their bid prices to ensure a competitive bid.
- Secondary ad approvals – If a Publisher has approved the ad in Place Exchange but is still waiting for secondary approvals in their system, the winning creative will not be played. It is best to ensure secondary approvals can be completed as quickly as possible.
- Creative separation – Some publishers ensure there is a time delay before the same ad is played again. If the same creative wins an auction in Place Exchange within that time window but the Publisher chooses to not play it, the play return will drop as expected.
- Publisher enforced timeouts – If a publisher enforces a hard time out for SSPs to return a response, it is possible that Place Exchange sends an ad response that is disregarded. This can cause a drop in play return rates from Place Exchange's perspective. In these cases, we need to investigate the source of the latency. Contact help@placeexchange.com.
- Place Exchange timeouts – Depending on the Publishers’ tech stacks, the play notifications sent to Place Exchange might be delayed beyond the expected time windows set for certain Buyers. This requires further investigation into the Publishers’ systems to see whether these were one off delays, or require tech upgrades on the Publisher’s side. Contact help@placeexchange.com.
- Network/API Issues – Play notifications sent by the Publisher can be delayed due to network issues, or rejected due to errors in the API requests. Contact help@placeexchange.com for further assistance troubleshooting.
Publishers only get paid for play notifications that Place Exchange receives. Depending on the DSP, a campaign with a low play return rate can run into:
- Pacing issues – Some DSPs have issues pacing campaigns if they do not see a response back to their bid response.
- Drop in bids – Some DSPs automatically stop bidding on supply that they have a low chance of winning.
If the low play return rate is due to the Publisher running secondary auctions or participating in demand unification with another SSP, they are not losing revenue. But in all other cases, that Publisher is likely losing out on spend.
Yes, it is possible to see a play return rate of more than 100% in the following cases:
- When a user filters the reporting data to include the current date, the play return rate may exceed 100% until the system completely processes the hourly data. This temporary anomaly lasts only a few hours. To prevent this confusion, users should exclude the current date from their filters.
- If a past date displays a play return rate exceeding 100%, duplicate play records caused the inflation. This rare occurrence remains within the standard 3% discrepancy threshold.
Many of our drill down views contain a column for the Buy Side Fees Amount. When you come across a view where you see the Buysidefees Amount, you can drill into it to get more details about the underlying data.

You can also use the BuySideFees Records explore in the Advanced Analytics to get detailed insights into the Buy Side Fees data.
Custom Reporting
More detailed reporting breakouts can also be scheduled for automated delivery via email. To request scheduled reporting, please email help@placeexchange.com.
For additional details on what is available via email, see Custom Reporting for Publishers.