 minute read
This page describes how to create and manage custom reports with the Explore feature.
- The Explore feature is available to users with Standard access. Users with Viewer (read-only) access do not see the Explore option and cannot create or edit custom reports.
- The system stores all saved Looks and Dashboards in a shared “My Folder”, which means other users within your organization can view and modify them.
- Access is scoped based on your organization permissions. Users will only see data for the organizations to which they have access.
Explore - Custom Reports
Place Exchange
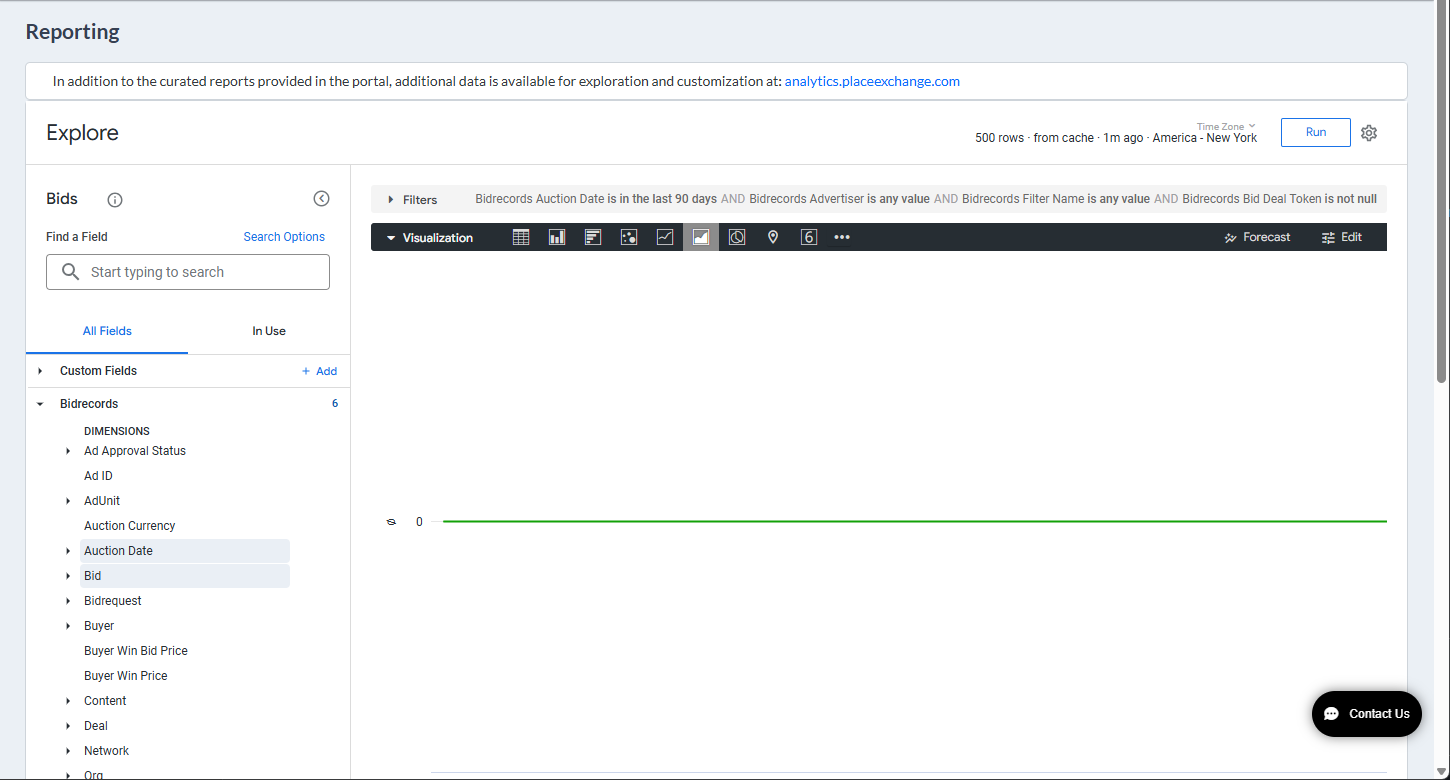
The Explore feature lets you create custom reports based on datasets available to you. You can filter, sort, and visualize data before saving it as a Look or adding it to a Dashboard.
Explore is embedded directly into the Portal, so you don’t need to leave the app to create reports.
You can access the Explore view in two ways:
- From any tile in any of the available reports.
- From the left menu. This option is enabled only upon request.
Access the Explore view from report tiles:
- Click the Explore from Here icon of a tile.
![]()
This brings you to the Explore view, where you can get detailed custom insights into the values.
The dataset is already selected for you.
Access the Explore view from the left menu:
- Access the Place Exchange Publisher Portal and select Explore under the Reports menu on the left.
- Select a dataset from the Choose Explore drop-down menu above the Explore window.
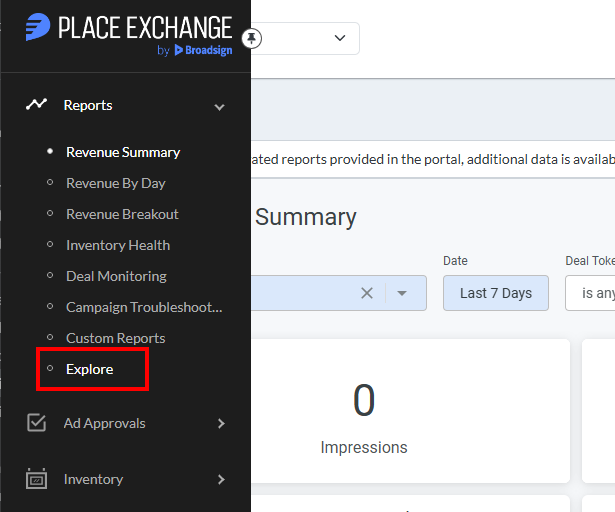
This brings you to the Explore view, where you can get detailed custom insights into the values.

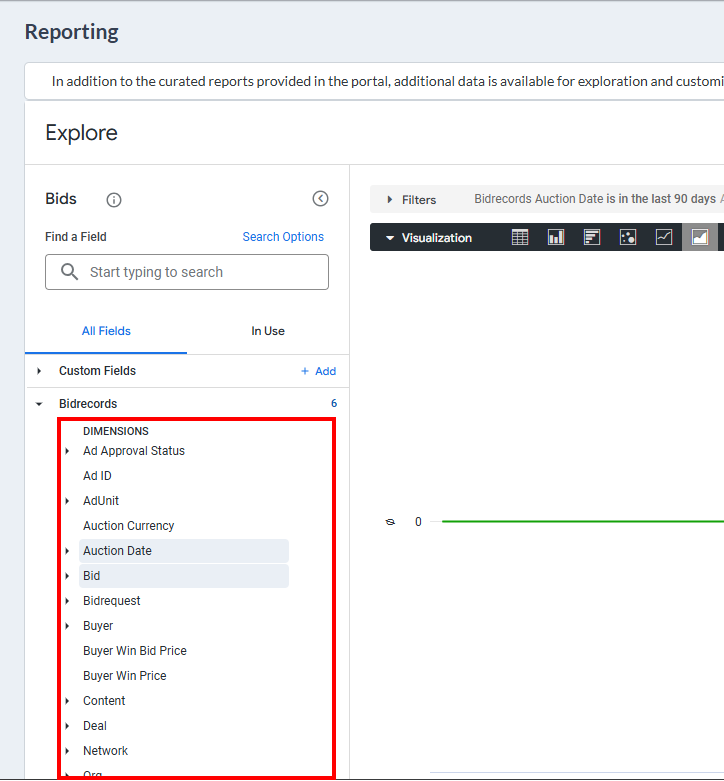
Build Your Report:
- Select Dimensions (Adunit Name, Approved Creative ID).
- Select Measures (Count, Revenue).
- Apply filters to narrow down results.
- Pick a visualization (Table, Bar Chart, Pie Chart).


Run the Query:
- Click the Run button to see the results update in real time.

Save as Look:
- Use the
 gear icon in the top-right of the Explore view.
 - Choose Save As a Look.
- Give it a name and optionally choose a folder (defaults to "My Folder").

The Look will now be visible in the Custom Reports tab.
Save to Dashboard:
- Use the same icon.
- Choose Save As a new dashboard or Save To an existing dashboard.
- Name your dashboard and save.

Dashboards will also appear in the Custom Reports section.
The system automatically lists saved Looks and Dashboards in the Custom Reports section of the sidebar. These are pulled from your shared My Folder in Looker.
| Feature | Dashboard | Look |
|---|---|---|
| Purpose | Combine multiple visualizations | Single query and visualization |
| Layout | Grid-based, drag & drop | Basic, single block |
| Use Case | KPI dashboards, overviews | Quick custom reports |
| Filters | Dashboard-wide filters available | Filters apply to one visual only |
- Use Save As a Look for quick, reusable insights.
- Use Save As a new dashboard or Save To an existing dashboard to group multiple visuals together.
- Use filter suggestions in Explore to guide your selections.
- Leverage sorting and pivots to enhance analysis clarity.
Check the Reports > Custom Reports from the left side navigation menus. You can also try searching the dashboard or look name in the Custom Reports table view.
Yes, if you have the right permissions. Click the three-dot menu next to the report in Custom Reports.
If it has been a long time since you logged in, some custom reports may have been archived. Contact help@placeexchange.com and we can help you restore them.
