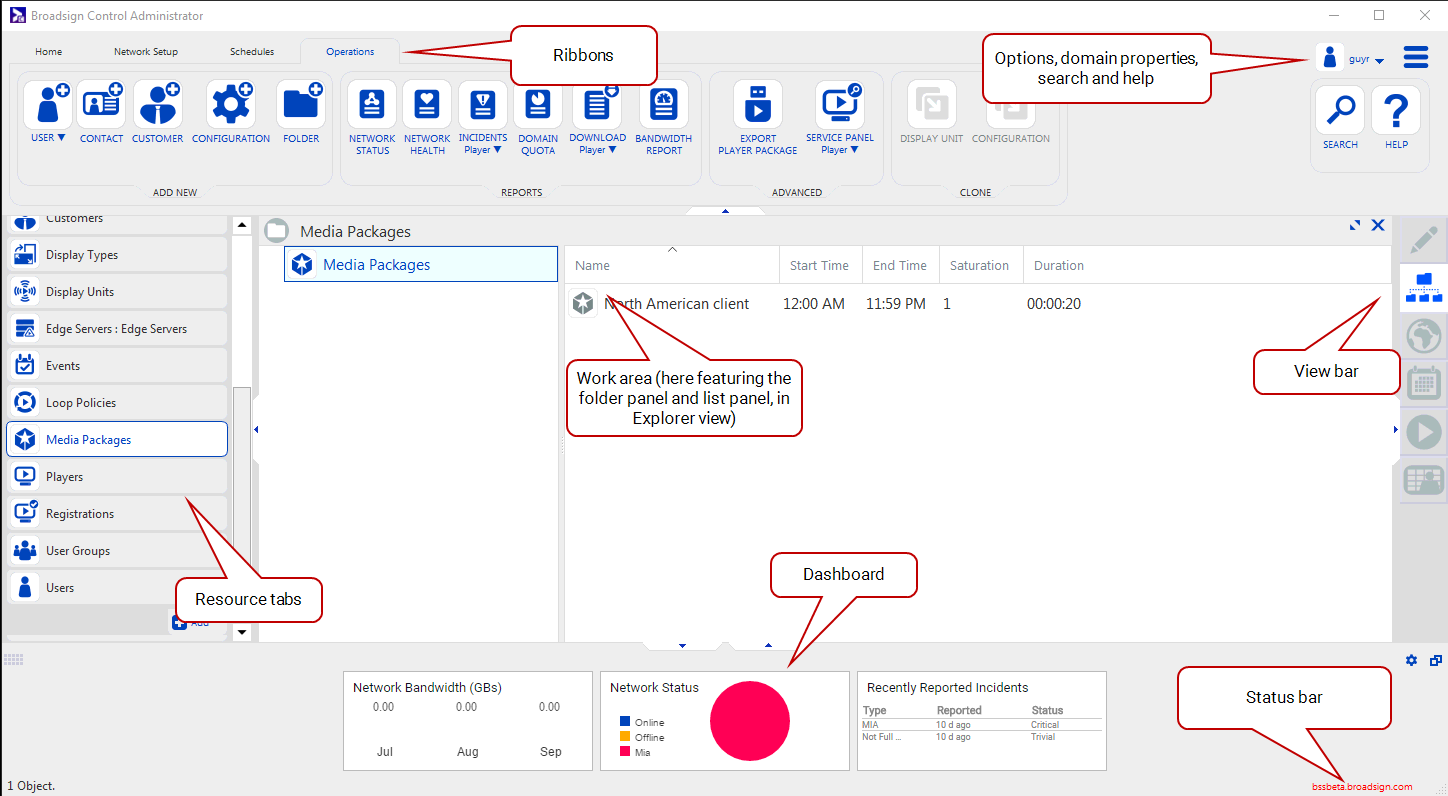
Broadsign Control Administrator's workspace is flexible, and centers around the work area (see Work Area).
The "Touring the Broadsign Control Administrator Workspace" training video is part of the "Introductory" playlist:
- 1 of 3 – Download, Install and Tour the Main Products
- 2 of 3 – Touring the Broadsign Control Administrator Workspace (below)
- 3 of 3 – Watch the Video
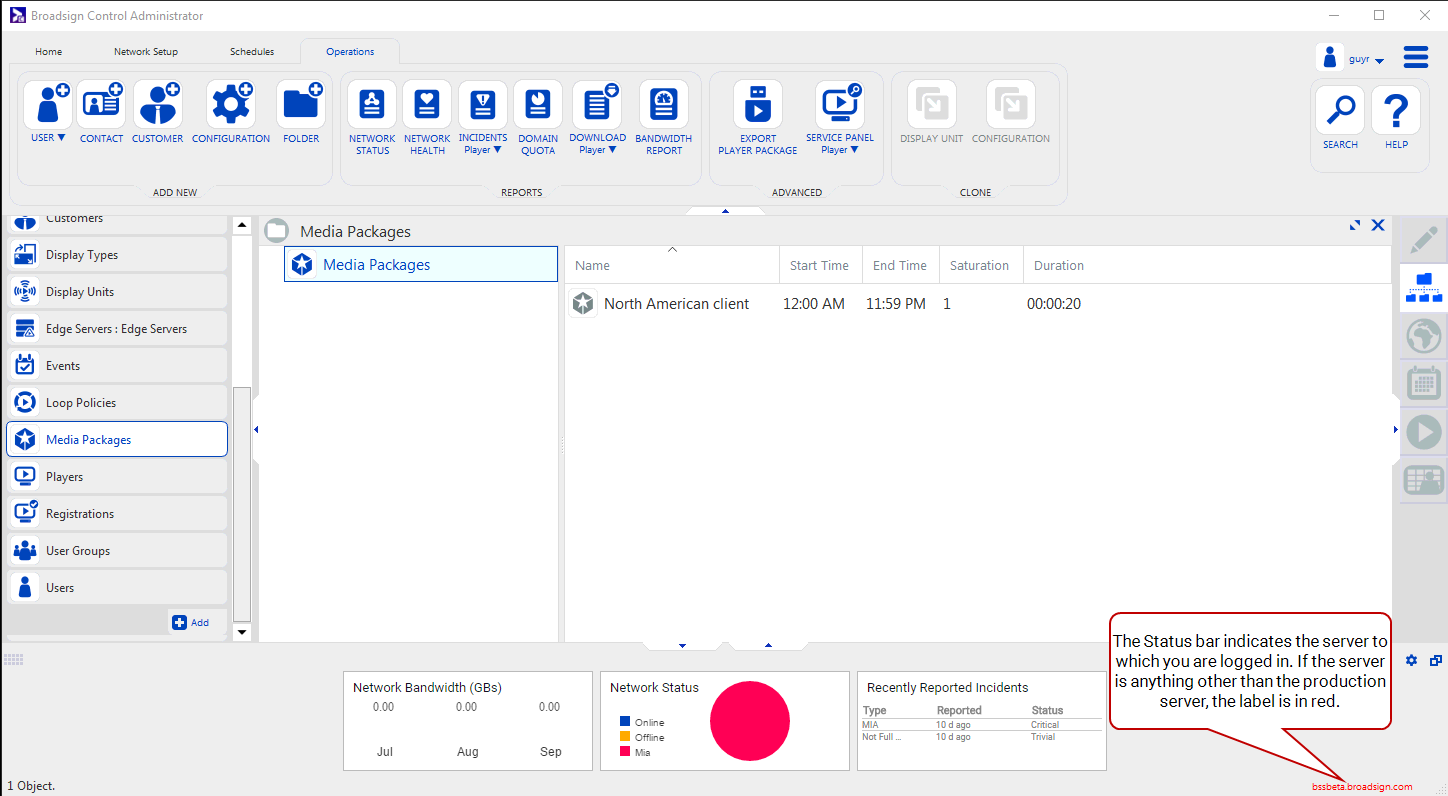
Touring the Broadsign Control Administrator Workspace – Outlines how to log in to Broadsign Control Administrator. Then describes the six main areas of its interface: the work area; the resource tabs; the ribbons; the view bar; the search/help icons and menus; and the dashboard.
Touring the Broadsign Control Administrator Workspace
The Ribbons organize tasks by the role of the user: Network Setup (see Network Setup Tutorial), Schedules (see Content and Scheduling Tutorial) or Operations (see Network Operations Tutorial). When you click on one of these choices, a ribbon of options relating to that role appear. Any selections made in the ribbon appear in the work area.
See Ribbons.
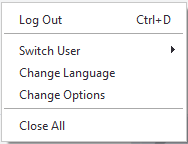
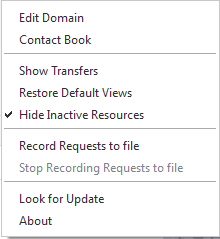
With these two drop-down menus, you can control options at the domain level (Domain properties), or at the application level (Options).
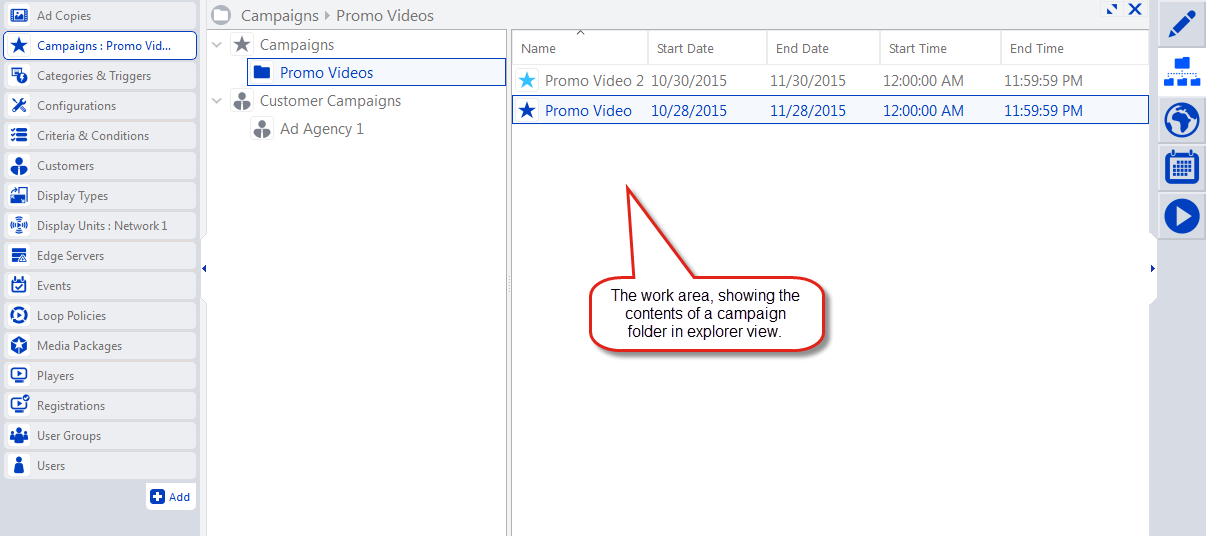
You can access both the folder panel and list panel (in explorer view), for any of Broadsign Control Administrator's resources, for example ad copies.
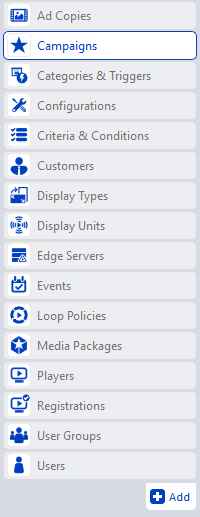
Resource tabs are configurable, so you can set them up any way you want. Also, resource tabs are tear-away, allowing you to open a new Broadsign Control Administrator window, while remaining connected to your domain.
See Resource Tabs.
What you see in the work area will depend on the view you select. For example, you could see all of your ad copies in a traditional explorer view, listing folders and files. Or, you could preview the ad copy: the image or video will appear in the work area as it would appear on your screen.
See View Bar.
The work you do in Broadsign Control Administrator will occur in the work area. Selections you make from the ribbons, the resource tabs, or the view bar will appear in the work area.
See Work Area.
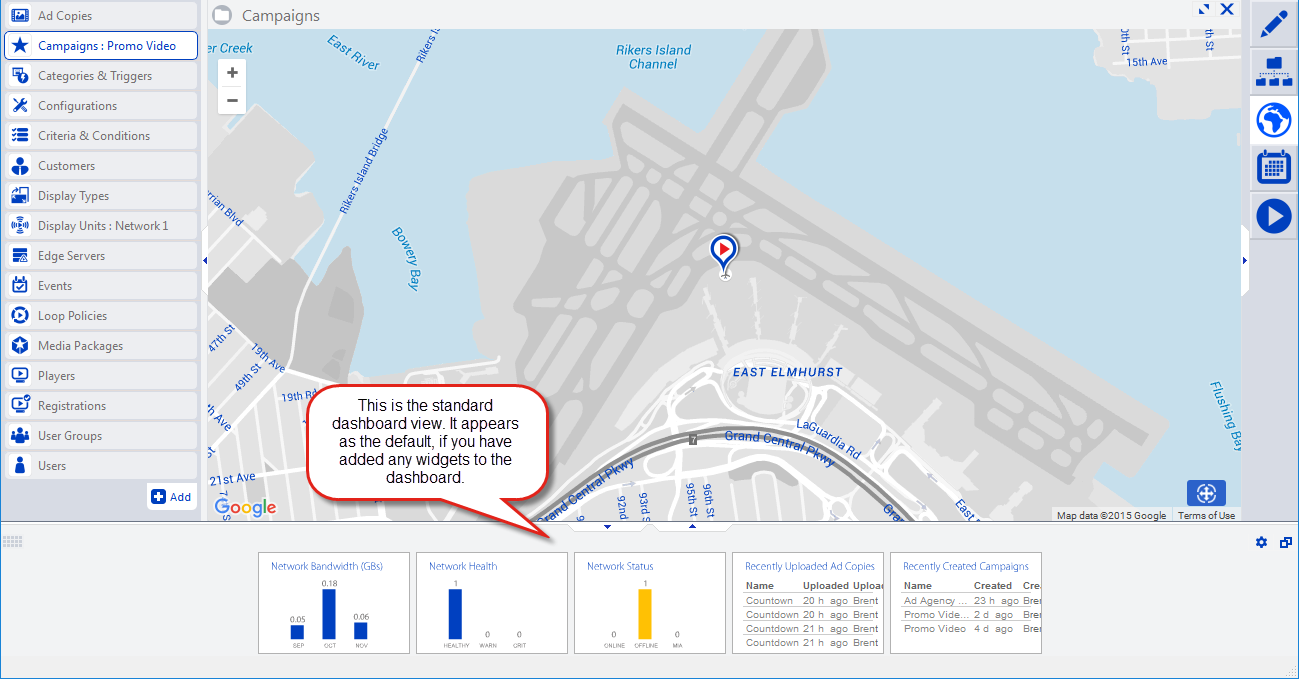
The dashboard provides graphs, pie charts and tables with which you can monitor the performances of different parts of your domain and setup. It is widget-based and, thus, configurable.
See Dashboard.
